

State of Decred, POS Edition
Decred ticket volumes are my favorite thing to track in the cryptocurrency space. I find the data fascinating, and tracking the volumes helps me gauge the “HODL Demand” for DCR throughout time.
By Permabull Nino - Oct 24, 2018 - A HODLers Update
Kick off note: The thoughts within the DRCR letter/blog posts are the thoughts of the author and the letters are not directly sponsored by the Decred project in any sort of way. These are written “for the love of the game”, and hopefully shed some light on one of the most interesting projects in crypto. If anything found within doesn’t sit well with you after reading this, the author (Permabull Nino — @ImacallyouJawdy) welcomes constructive criticism on Twitter.
Tickets Overview
Despite the price action, 2018 has been an epic year of growth for Decred. Huge strides have been made on the development, POW, and POS fronts. After drafting this post I realized that discussing progress for 2018 will be best done broken out individually. So, for the entirety of this post we will dive into Decred POS and notable data to show how things have progressed from January to October.
First let’s talk about ticket prices. Year to date, Decred tickets have increased from ~79 DCR to ~100 DCR, up approximately 25%. Around 400,000 tickets have been purchased this year, with the largest volume purchased in July.
The average ticket price for 2018 is ~91 DCR, ~$6,100 USD, and 0.75 BTC. For some perspective, the current ticket price is ~100 DCR, ~$4,000 USD, and 0.62 BTC. A few charts below will give us a better idea of where most “instances” fall in terms of ticket prices using USD, DCR, and BTC. Note: each “instance” represents a single 144 block window for ticket purchasing.
Frankly, the DCR chart is pretty clean, but the USD and BTC charts really give some perspective on this bear market. Decred had a decent run-up during Q2, but tickets have been pretty cheap, hovering between $3,300 — $4100 USD and 0.48–0.58 BTC for most of the year (most it cost to buy a ticket was around 1.4 BTC).
Tickets Volume — The Heartbeat of Decred
Decred ticket volumes are my favorite thing to track in the cryptocurrency space. I find the data fascinating, and tracking the volumes helps me gauge the “HODL Demand” for DCR throughout time. There are multiple ways you can digest the ticket data, which includes (1) raw ticket data, (2) ticket data denominated in DCR, and (3) ticket data denominated in USD. I do some tracking of the volume data denominated in BTC amounts but to date it hasn’t provided me with much that is worth sharing/further explaining. So, for our 3 quarters update on POS data we will focus on the 3 above.
The most obvious thing you will see in the raw tickets volume data is that the ticket retargeting baked into Decred operates almost impeccably. In the first graph below, we have the ticket data for 2018 plotted, and in the second graph we have the ticket buying momentum throughout 2018. In both cases, you will notice that the ticket buying constantly is fighting back to equilibrium after overshooting/undershooting the ticket volume targets. What’s also interesting in the second chart is that you can see there truly is momentum to ticket purchasing, we are either in big buy periods of tickets or periods of relatively little demand.
The way tickets are purchased are comparable to a digital heart rate, with periods of high or low activity, but eventually always crossing back to equilibrium/the resting heart rate.
Chart 1 Note: 720 is equilibrium for ticket volume
Chart 2 Note: 0 is equilibrium for ticket buying momentum
Where normal ticket volumes show a pattern of reversion back to equilibrium, ticket volume denominated in DCR shows a pattern that slants upwards and to the right. The total amount of DCR deposited into tickets for the year is reaching 40 million DCR, almost 5x the current supply. Also, there’s a clear uptrend of DCR going into tix daily (140,000 DCR/Day on average) and block by block basis (490 DCR/Block on average). What is particularly interesting is the jump in the DCR in Tix/Block starting in April, where we saw the largest month to month jump of the year (10%+). During the period that followed we saw Decred retest ATH in price, and a multitude of funds going public with their investment in the DCR coin/ecosystem. I’m going to come out and say that this period will be looked back on as the beginning of the Decred tidal wave that will hit the crypto space in the next 18 months.
Another thing that you always want to make sure you’re paying attention to is inflation. More DCR are going into tickets over time as a natural result of inflation. Despite Decred’s large inflation figures (~25% overall for 2018), DCR tix data shows us that HODL Demand is keeping pace, with a 20% increase in DCR going into tix/block over the course of the year.
Ticket Volume vs. POS Inflation
How does all of this translate into USD figures? At a high level, over $2.5 billion (note: adjusted for daily USD prices) has flown through tickets in 2018 with ~$35 million dished out in POS rewards. The ticket volume to POS reward ratio currently sits at 81, with a clean uptrend (as it should, as POS rewards decrease every 3 weeks). The only notable “dip” we had in this ratio was during our June-July capitulation-esque dump in prices as can be seen circled in the chart below. Just to be clear: this chart shows you how many DCR are going into tickets for each newly minted DCR given to stakers from block rewards.
This ratio is of interest to us because it lets us know the return that Decred is getting from DCR hodlers over time.
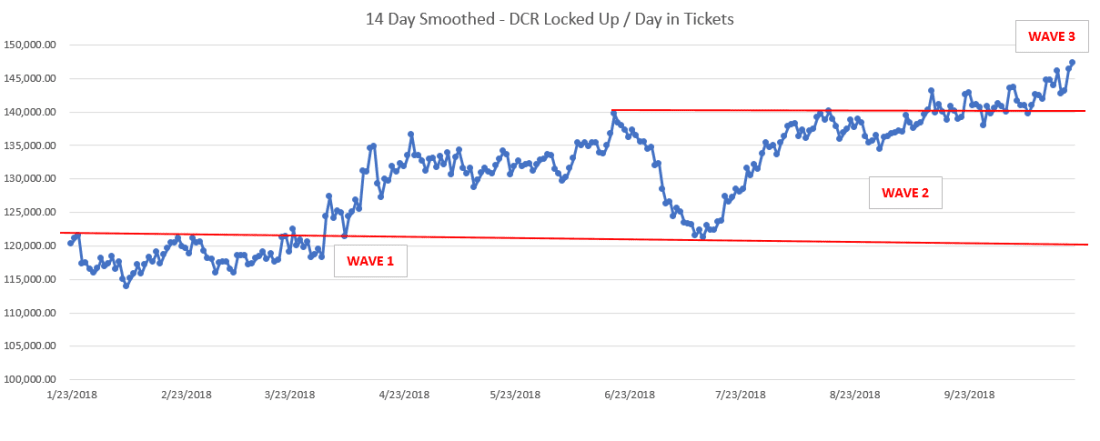
DCR HODL Waves
The last thing I want to browse over is the concept of “HODL Waves”. During 2018, there’s been 3 different HODL waves for Decred, with waves 2 and 3 marked out by a breakout in DCR being deposited into tickets. Wave 2 began at the beginning of Q2, and it seems wave 3 is beginning as we kick off Q4. What’s particularly of interest is that the waves are easy to identify, and that it seems each wave begins with a breakout, gets rejected a point of resistance, HODL demand moves sideways for a bit, and then eventually ends up breaking out again for the next HODL wave. As we kick off this new wave I’ll be keeping an eye on where the HODL demand meets resistance for wave 3.
Conclusion
Demand to hodl DCR has exploded during 2018, and hopefully the discussion within has helped highlight this. My goal for foreseeable future is to keep diving deeper into the ticket data and help shed some light on the intricacies of DCR hodler demand. If you found this writeup interesting feel free to reach out, always happy to talk some BTC, DCR, and especially DCR ticket data!
Permabull Nino (@ImacallyouJawdy)


Comments ()