

Decred On-Chain Mini Pub 3: Difficulty Ribbon Price
Before showing the tools with their respective calculations, please note that “mining capitulation” will be considered to be taking place when actual mining difficulty collides with the 200 day average of mining difficulty.
By Permabull Nino - Jul 29, 2020 - A Tool for Estimating Mining Costs
Relevant Reading
Rationale
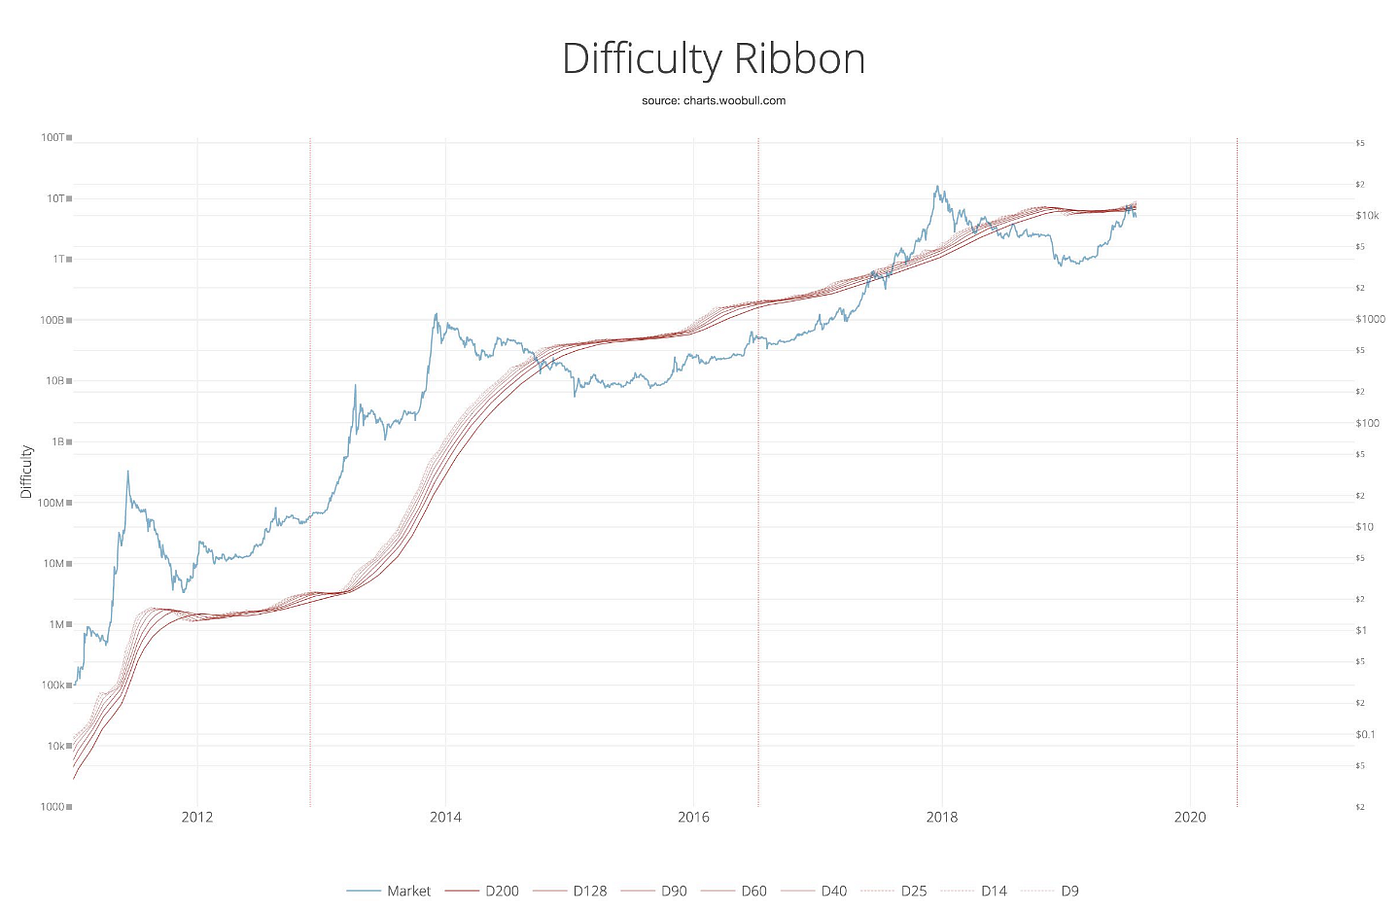
- The Difficulty Ribbon was an on-chain tool created by Willy Woo in order to track distress among Bitcoin miners
- The Difficulty Ribbon consists of the (1) the network difficulty and (2) an assortment of moving averages of difficulty, with the 200 day moving average being the slowest-moving
- Contractions in the Difficulty Ribbon have been historical signals for mining capitulation i.e. actual price is very close to the cost of mining
This tool is a simple, high-signal way for the average person to gauge the current state of mining within a cryptocurrency network. Furthermore, it doesn’t rely on electricity cost assumptions or other complex means to track mining costs. If we can glean more information from this strong base, we can gain a better understanding of the economics behind a large stakeholder group within the Decred ecosystem: miners.
With the above in mind, we’re going to expand on the Difficulty Ribbons in the following ways:
- Show that Difficulty Ribbons can provide a reliable estimate for the current cost to mine
- The cost to mine can also be estimated on a DCRBTC basis
- Illustrate the impact of ASIC introduction on the cost to mine, and how this impacts price action
- Why “mining capitulation” is a quality marker for bear market bottoms
On-Chain Toolkit
Before showing the tools with their respective calculations, please note that “mining capitulation” will be considered to be taking place when actual mining difficulty collides with the 200 day average of mining difficulty. When this occurs, there’s sufficient evidence to suggest that growth in mining is reaching a stand-still due to a lack of profitability.
Relevant tools for analysis with their respective calculations are included below:
Difficulty Multiple: The ratio between current mining difficulty and the 200 day mining difficulty average. This ratio represents the current market traded price in ratio form.

USD Difficulty Price: Multiply the inverse Difficulty Multiple by actual price to determine the cost to mine. This shows what the USD price would be if the current mining difficulty was equal to the 200 day mining difficulty average.

BTC Difficulty Price: Divide the USD Difficulty Price by the actual Bitcoin price to determine how many BTC miners could receive if they sold their rewards into BTC on the day they were mined.

Why Do These Tools Matter?
Miners are the largest natural sellers of any PoW cryptocurrency. Conversely (and generally speaking), they’re also the cheapest accumulators of coins — by acquiring coins below the current market traded price.
An increase in mining profitability (the ability to acquire coins below market traded price) is sharp on both sides:
- Allows a larger cross section of miners to hold DCR without selling, however…
- It keeps less efficient miners in the game, who need to sell more coins as price starts moving downwards
Actual price increasing can improve profitability, however this article is focused on the cost side of the equation. Now, there are two ways the cost to mine can decrease:
- Difficulty adjusting downwards, lowering the minimum threshold to generate a hash below target or
- Hash becomes cheaper to acquire, due to improvements in hardware which allow more hash to be generated per unit of electricity committed
The introduction of ASICs for Decred took place in early 2018, and with this came a large decrease in the cost to acquire hash. Depending on timing, this can weigh very heavily on price for a cryptocurrency. In the case of Decred, it got the worst of both worlds: the evaporation of the marginal buyer (which happens for any coin in a bear market) and a decrease in the cost to mine, allowing miners to keep selling their DCR profitably at much lower prices.
This inevitably kept pushing prices lower until selling no longer became profitable for marginal sellers and most importantly natural sellers (miners). This line in the sand where selling no longer is worthwhile occurs at the cost to mine DCR. The charts and analysis below should help everyone better understand the mechanics that have been at play since ASIC introduction, and equips everyone better for future market cycles.
Charts + Analysis
It was important to test the validity of the Difficulty Ribbon Price (DR Price) versus Bitcoin, as (1) the original Difficulty Ribbons were initially created for Bitcoin and (2) Bitcoin has a longer history to test them against. As such — we will below first look at BTCUSD versus the DR Price, and then expand by looking at the DR Price versus DCRUSD & DCRBTC.

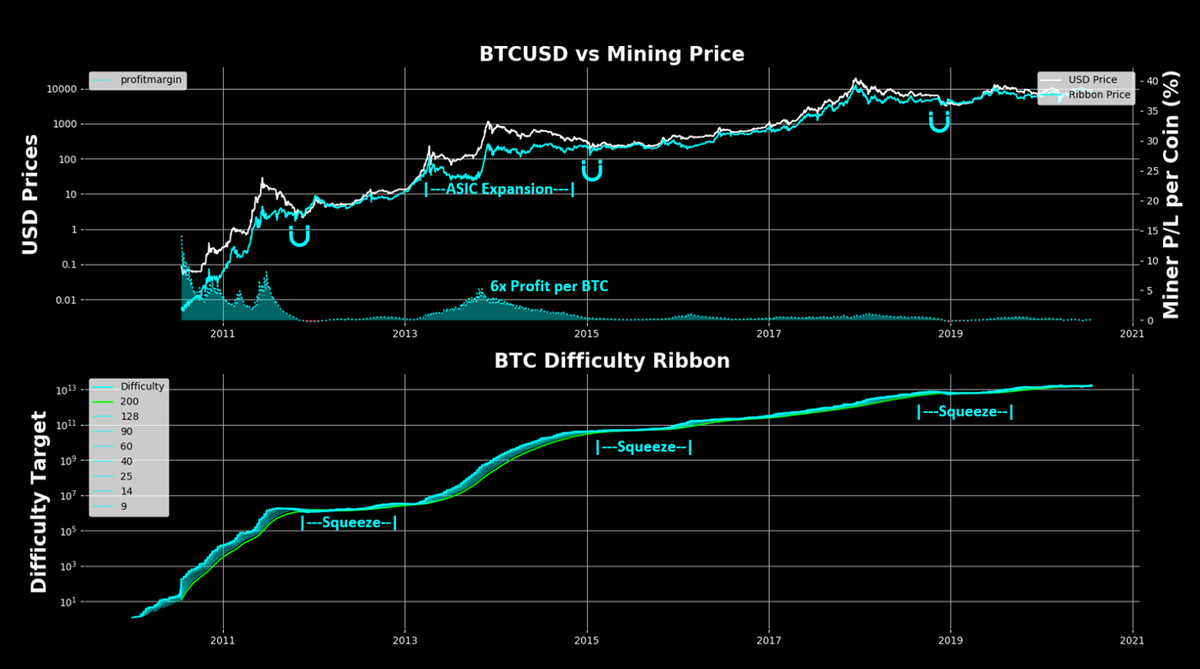
- BTCUSD: Top panel, white line
- Bitcoin DR Price: Top panel, blue line
- Difficulty Ribbons: Bottom panel
- The Bitcoin chart shows three boom/bust cycles, ending in 2011, 2015, and 2019
- Bitcoin ASICs were introduced during the 2015 cycle, as can be seen by the wide Difficulty Ribbon and large gap between BTCUSD and the DR Price
- The DR Price telegraphed where the eventual price bottoms were on all three occasions (see magnets on chart)
- Mining Profitability implies that miners could have been earning as much as 6x in late 2013, which was the peak period of difficulty growth following ASICs
- Mining Profitability has never revisited the levels it was at during peak ASIC transition
- Bitcoin’s second bust cycle / time to bottom lasted an entire year (all of 2015) — by far its longest, likely due to needing more time to shakeout new ASIC miners
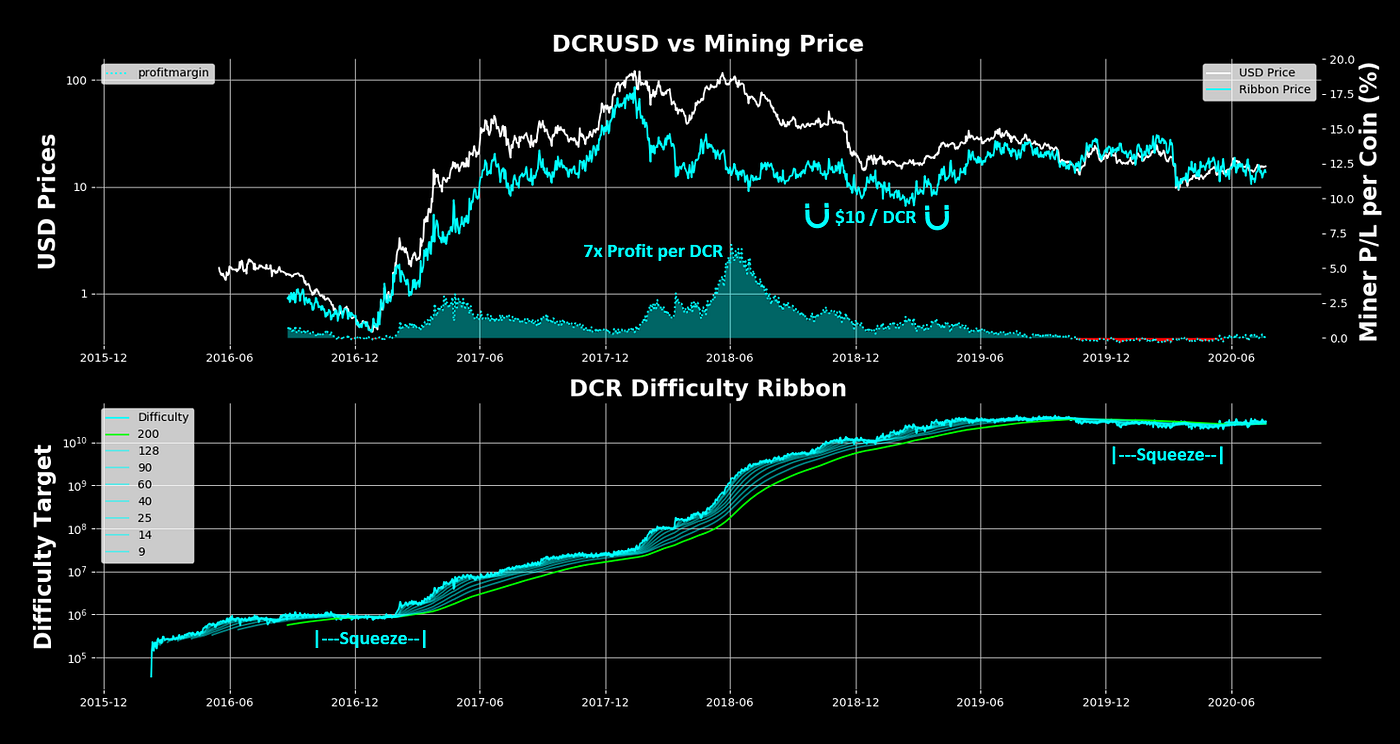
- DCRUSD: Top panel, white line
- Decred DR Price: Top panel, blue line
- Difficulty Ribbons: Bottom panel
- Decred has a much shorter history than Bitcoin, with only one true boom/bust cycle
- However, DCRUSD has had two collisions with the DR Price, once in late 2016 and in 2019–2020
- The DR Price shows that ASIC introduction kicked off early 2018, with a steep decline in price
- Mining Profitability implies that miners could have been earning as much as 7x in middle of 2018, which was the peak period of difficulty growth following ASICs
- By the middle of 2018, the DR Price had hit $10 / DCR
- Once again — the DR Price has been a magnet for price in bear markets
- Decred’s bust cycle has lasted from 9 months if you measure by when DCRUSD collides with DR Price, and 18 months if you measure by sideways DCRUSD price action
- In Decred’s case, the DR Price moved upwards to collide with the DCRUSD price — showing that DR Price can move upwards to put in a bottom as well (as opposed to DCRUSD needing to go downwards to put in a bottom)

- DCRBTC: Top panel, white line
- DR DCRBTC Price: Top panel, blue line
- Mining Profitability: Bottom panel
- Note: this shows the amount of BTC a miner could acquire from their mined DCR
- ASIC introduction in early 2018 pushed the DR DCRBTC Price down to ~.002 DCR / BTC, where it has remained for more than two years
- The biggest takeaway from this chart is that the DR DCRBTC Price nailed the bear market bottom price for DCRBTC
- This view of DCRBTC price action can be useful for future Decred market cycles, as its true bottom generally can’t be considered to be in until its BTC pair bottoms
- An argument can be made that this ~.002 DCR / BTC area was always the bear market bottom price target for DCRBTC
Final Point
It’s important to end on the following points:
- The Difficulty Ribbon Price is best used as a macro tool as opposed to a precision tool for short term trading
- ASIC introduction has had a massive impact on Decred price action, and likely caused it to have a particularly tough bear market recovery
- Mining profitability will likely never return to early ASIC levels, which likely means that less bleed-out will be required to put in Decred’s next bear market bottom
Signing out.


Comments ()