


While stakeholders have to date done a great job budgeting for the Treasury, it still seemed worthwhile to attempt to build a public-facing budgeting tool
By Permabull Nino - Sep 8, 2020 - Accounting for Distributed Collectives
Relevant Reading
Treasury Foundations
Decred is many things:
- A money
- A high assurance accounting machine
- A distributed workforce aiming to build on points 1 & 2
The Decred Treasury is the foundation for point 3, which funds a distributed collective of contractors ranging from developers to project marketers. There are a few things which make the Treasury funds unique:
- Funding is limited: there are currently ~600,000 DCR in the Treasury balance and approximately 900,000 DCR remaining in Treasury issuance
- Treasury funds are allocated by those with skin in the game, which in Decred’s case is stakers (i.e. ticket holders)
With these factors considered, we can make a few takeaways:
- Ticket holders need to be discerning over where Treasury DCR are allocated, as funds are limited and can run out
- Ticket holders are looking for an ROI on their invested Treasury DCR
Through the duration of the Decred bear market there have been a swath of proposals published, approved, rejected, and even abandoned. Inevitably (and understandably), each proposal came with concerns over where Treasury funds were allocated, and whether the ROI on a proposal passed the sniff test. As someone who was an accountant in a prior career-life, this presented itself as an opportunity to nerd out and hopefully provide some useful tools for better understanding the Decred Treasury today and into the future.
Within we will run through a high-level accountant’s report to the Decred Treasury via the following approach:
- Basic view of the Treasury including balance, spends, etc.
- DCR Contractor P/L
- DCR Treasury Flows
- DCR Treasury Budgeting
- DCR Treasury Runway
- DCR Treasury Returns
Basic View of the Treasury
Below we will cover the basics of the Decred Treasury from both a DCR and USD focused point of view. Establishing a baseline within this section should provide sufficient context for the remaining analysis.
Note: Decred contractors bill to the Treasury in USD, and the sum of DCR sent to contractors is determined by dividing sum of USD billed by the average DCRUSD price of the month work is being billed towards
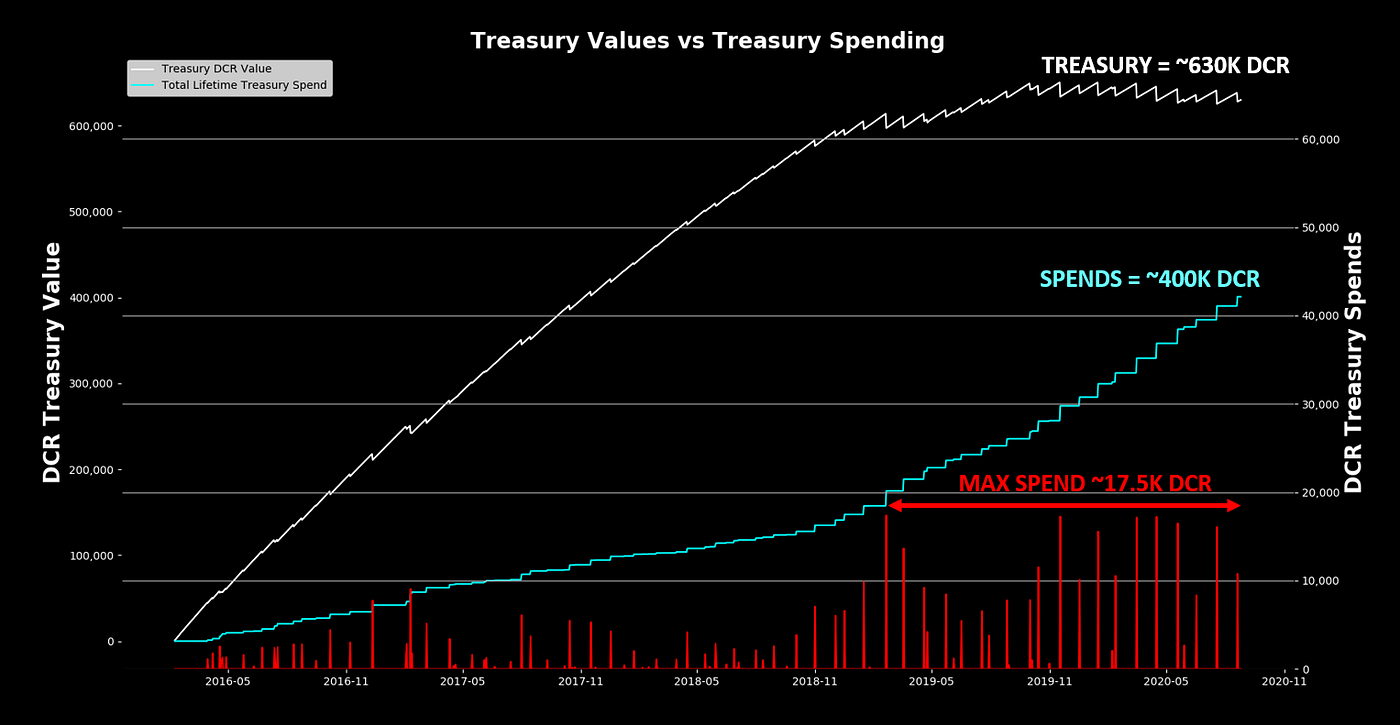
- The chart above plots the Treasury (white line) and cumulative sum of DCR paid to contractors (blue line) through the project’s lifetime
- Red bars show the daily sum of DCR sent to contractors
- The Treasury balance has hovered around 600k — 630k DCR since early 2019
- Cumulative DCR sent to contractors currently sits around 400k DCR
- Maximum daily spends of DCR has consistently hit ~17.5k since early 2019, around the same time the cumulative spends line started to accelerate upwards
- To date, there seems to be two different eras of DCR Treasury spends
- Era 1: small DCR outlay, and payments paid in smaller / separate batches
- Era 2: larger DCR outlay, and payments made in larger / joint amounts
- These two eras are divided by the introduction of Politeia, which launched late 2018 — representing a clear shift in the Decred DAO by formalizing the contracting process
- Another divider of these eras, and what can at least explain the increased DCR outlay is the DCRUSD price moving to bear market lows — where price has settled since then
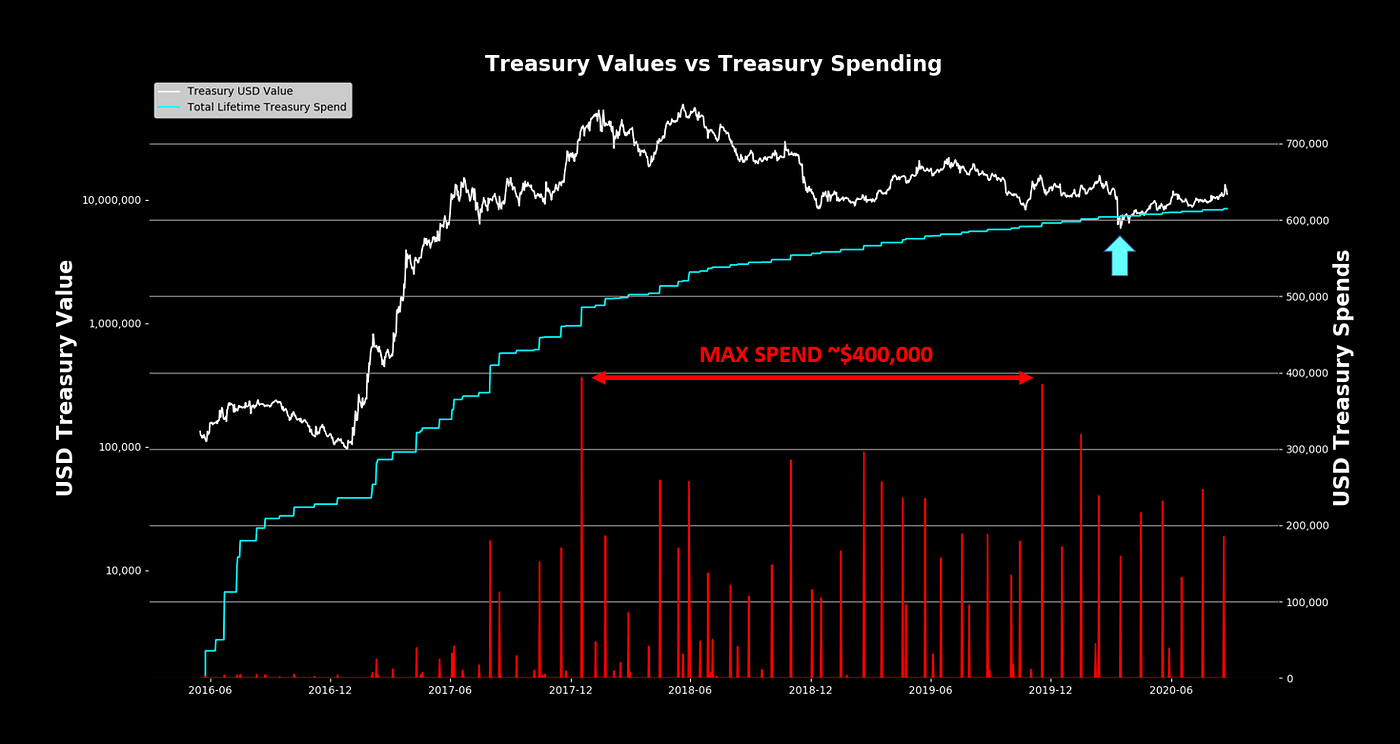
- The chart above plots the Treasury value in USD (white line) and cumulative sum of USD paid to contractors (blue line) through the project’s lifetime
- Red bars show the daily sum of USD sent to contractors
- USD outlay is calculated by using the USD price on the day the DCR were transacted
- Treasury Value: ~$10 — $11 Million
- Cumulative Spends: ~$8 — $9 Million
- Max USD Daily Outlay: ~$400k
- The value of the Treasury collided with Cumulative Spends on the “doomsday candle” from Covid-19 shutdowns
- Since the middle of 2017, contractor pay has consistently remained between $100k and $300k
- This well defined range of spending can be used as a possible measure of two things: (1) contractor retention and (2) budgeting
- The easiest way to measure contractor retention / growth is by looking at the USD value of Treasury spends
- As such, the consistent spending can be viewed as bullish because it signals contractors remain within the working ecosystem
- Or, this can be viewed as bearish because it signals little growth in newcontractors
- From a budgeting perspective the data looks quite encouraging: in a largely sideways DCRUSD market, spending has also remained sideways. This signals that stakeholders are conscious of not exhausting funds
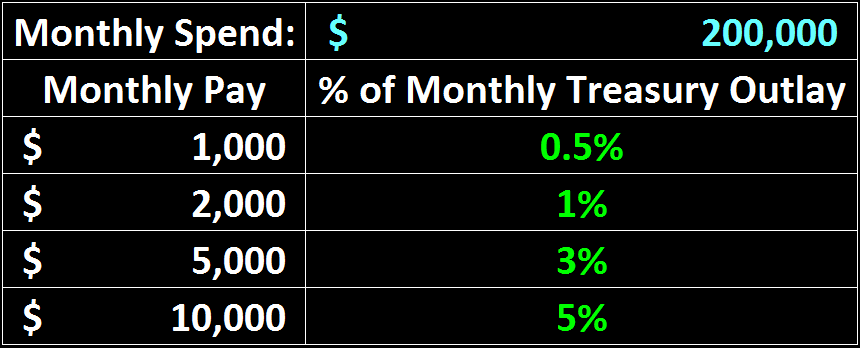
- USD payment data can also help stakeholders understand what share of Treasury spend a proposal is budgeting for
- The table above assumes the monthly spend of the Treasury is around $200k, and takes various monthly spend budgets for an individual contractor to estimate their portion of the total monthly charge
- By seeing what share of total Treasury outlay a certain proposal is budgeting for on a monthly basis, stakeholders can come up with their own benchmarks for what they consider reasonable
- The above is just a simple example of mental budgeting individual stakeholders can perform with available Treasury payment data (more on this in future sections)
DCR Contractor P/L
Contractors are the backbone of the Decred DAO and the ultimate Decred bulls. Furthermore, and as established in the previous section — they’re a significant stakeholder group, as they’ve received a cumulative ~400k DCR since project inception. In this section we’ll perform a quick pulse check on this group, and where their DCR bags stand.
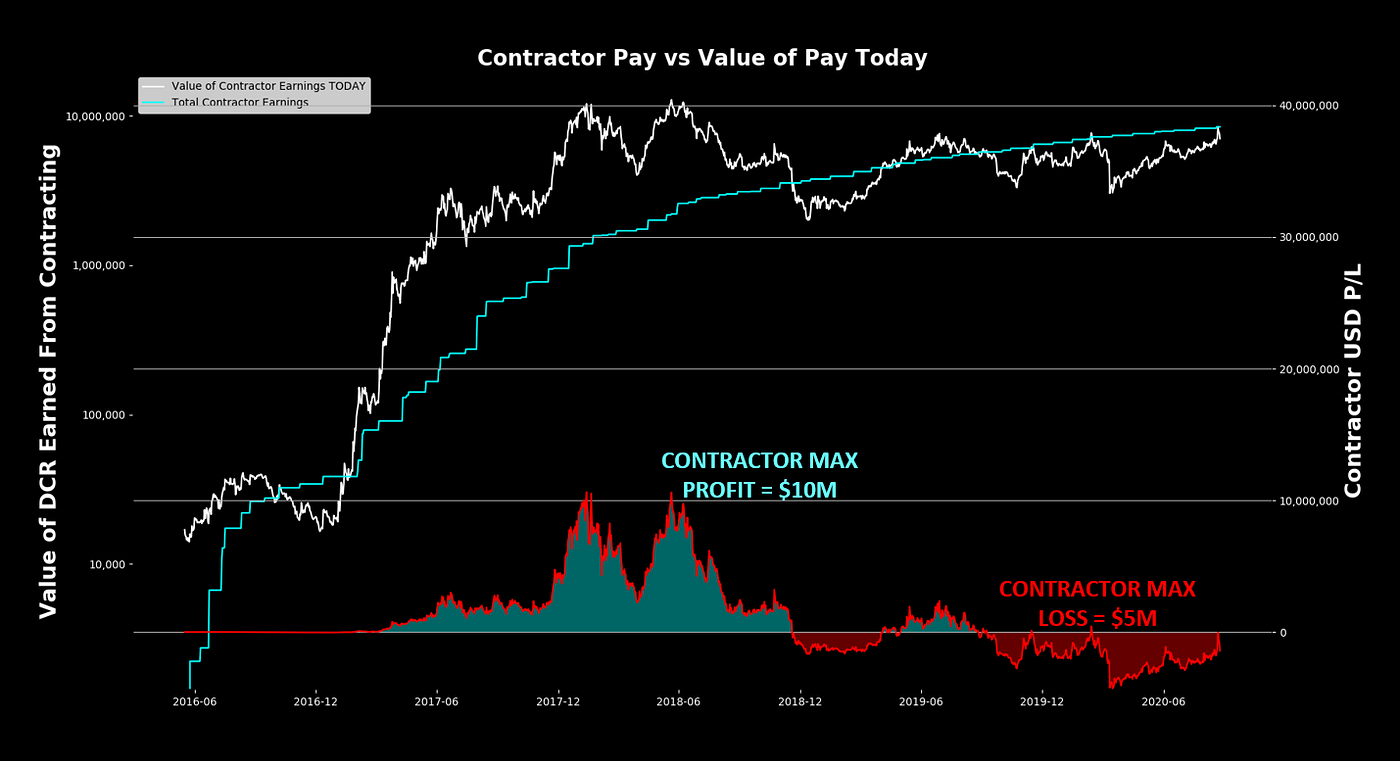
- Plotted above are (1) the current value of the ~400k DCR contractors have received (white) versus (2) the value of these same DCR based on the date they were paid out to contractors (blue)
- The bottom of the chart shows the $ difference between these two values, tracking their profits / losses on their DCR received to date (assuming no coins haven’t been sold)
- Note: although contractors do not hold all their coins, there is convincing evidence that they do HODL a significant portion of their DCR payments for contracting work
- At peak bull, DCR paid to contractors were $10 Million more valuable than when contractors received them
- On the other hand, their max loss on payments were around $5 Million
- Contractors have had two periods of sitting on losses: late 2016 and late 2018 — present
- Contractors are currently sitting at breakeven, with their cost basis presenting formidable resistance since the beginning of 2019

- This chart expands on the one previously shown by (1) calculating contractor profits on a % basis and (2) plotting a line to show what seems like a significant psychological level for contractor pain (red)
- The red line shows when contractors are 40% underwater on their cumulative payments received, which has proven to be the “max pain” point for a reversal in price action on multiple occasions
- At peak bull, the value of contractor coins were ~12.5x more valuable than what they had received them at
- The current value of contractor coins (white) is around $7 Million, and the all time high is around $13 Million — making the current value of coins held / paid to contractors only 2x from a new high in Decred’s lifetime
DCR Treasury Flows
Network stakeholders have one goal for the Treasury: to keep increasing the amount of DCR that sit in it. Below is a basic view of the Treasury and its accumulation rate of DCR over a rolling 90-day span.
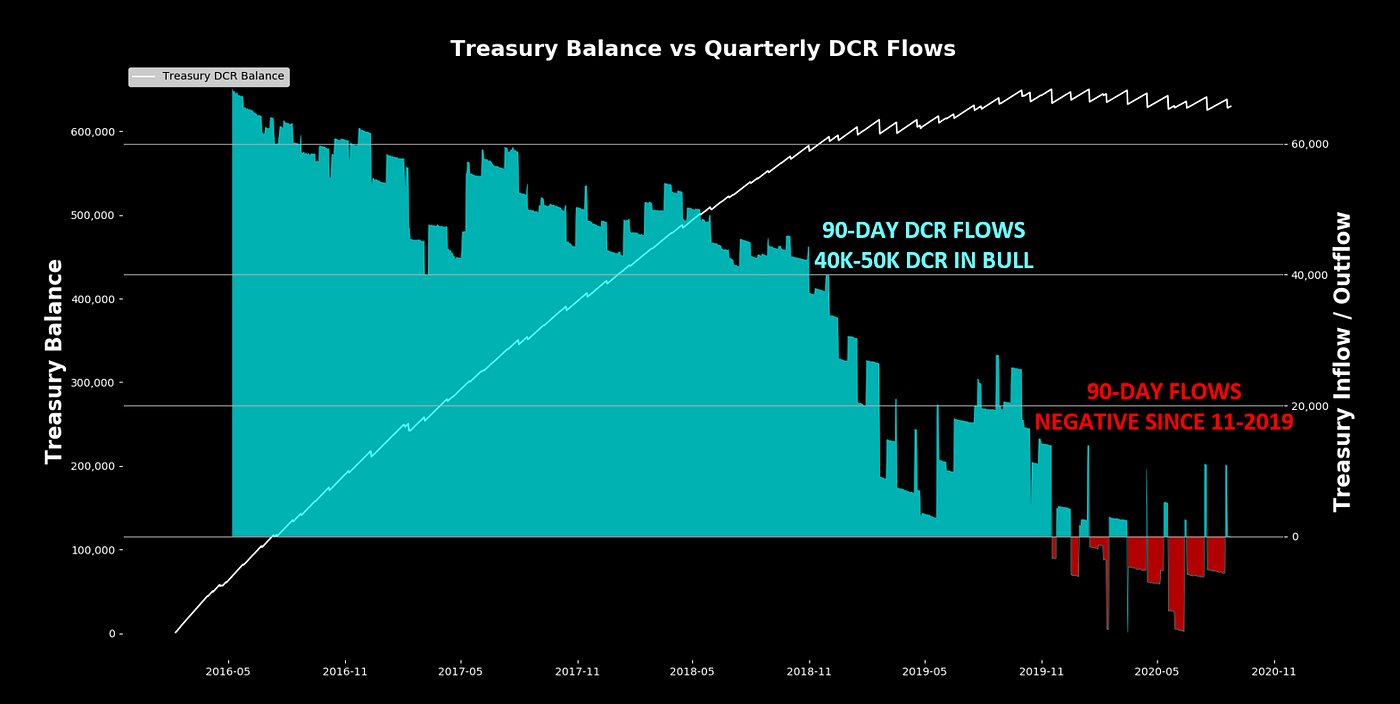
- From 2016 through 2018, the Treasury was accumulating between 40k — 50k DCR every 90 days
- DCR flows flipped negative in late 2019 after sustained bearish price action, and has yet to convincingly flip positive again
- The beginning of negative flows naturally makes stakeholders uneasy, which is why budgeting is important, and the topic of discussion in the next section…
DCR Treasury Budgeting
While stakeholders have to date done a great job budgeting for the Treasury, it still seemed worthwhile to attempt to build a public-facing budgeting tool. As such, we have two charts below, one building on top of the other:
- Top Chart: Current DCRUSD Price, plotted against various “Budget Prices” which show what DCRUSD price will allow for only certain % of Treasury being depleted on monthly contractor paydays. These prices are built based on the data from the bottom chart…
- Bottom Chart: Shows the largest % draw on the current Treasury balance over a rolling 90-day period (Max DCR Spend / Treasury DCR Balance)
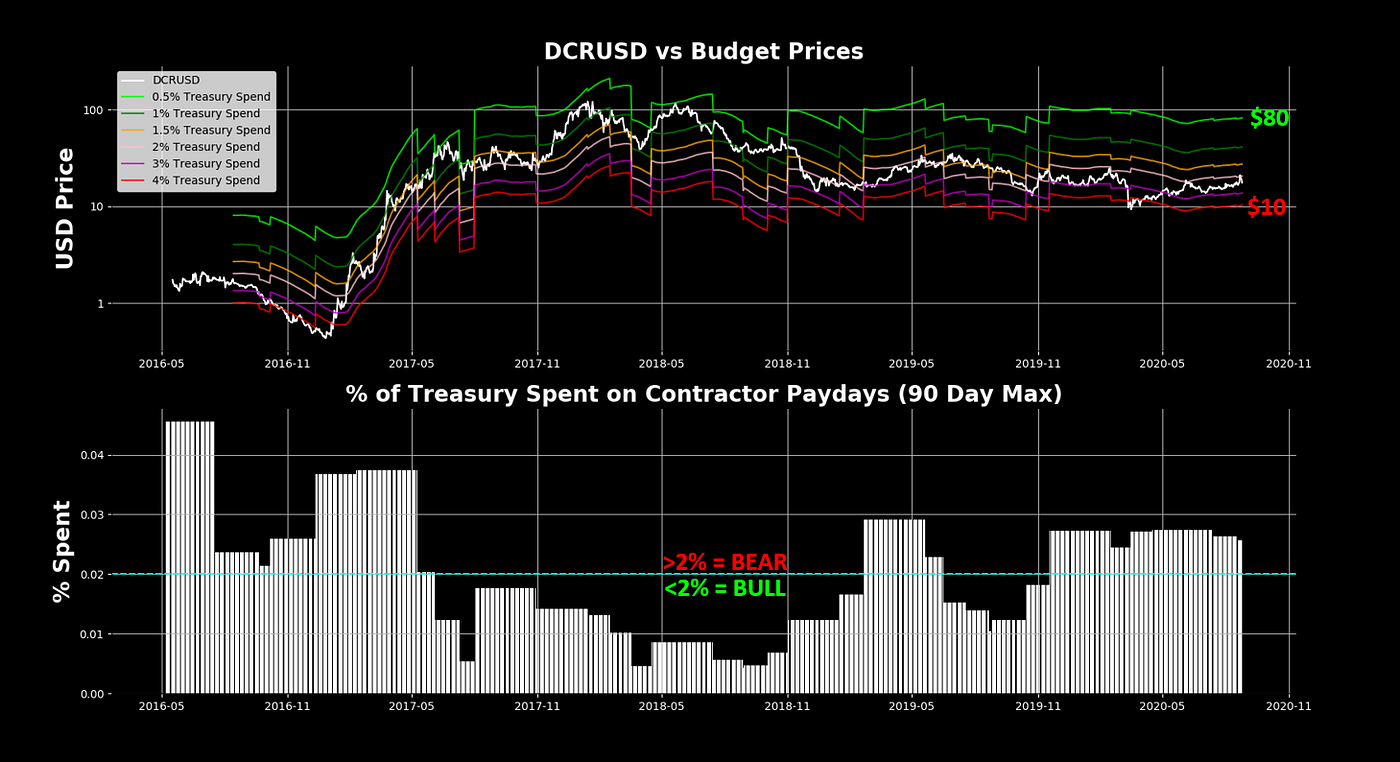
- Per the bottom chart, bear markets are defined by spends greater than 2% of the current Treasury balance, and viceversa for bull markets
- % of current Treasury balance spent monthly on contracting has ranged from 0.5% — 4% through Decred’s lifetime
- Budget Prices indicate that DCRUSD needs to be at ~$80 in order to only draw 0.5% of current Treasury balance on contractor paydays (bull case)
- Budget Prices indicate that DCRUSD needs to be at ~$10 in order to draw 4% of current Treasury balance on contractor paydays (bear case)
- Although not the main purpose of the tool, Budget Prices can be used to identify DCRUSD max pain / gain as it pinpoints areas of Treasury euphoria (low % draw of Treasury) and capitulation (high % draw of Treasury)
DCR Treasury Runway
Sustainability is a pillar Decred bulls hang their hat on. Fortunately, with available data we can place a number on the sustainability of Decred, and how this number has changed over time. Below we perform a simple calculation of taking the current Treasury balance + remaining DCR to be issued to the Treasury, and divide the sum by the max 90-day DCR spend to estimate how many months of runway the project has before exhausting all Treasury funds.
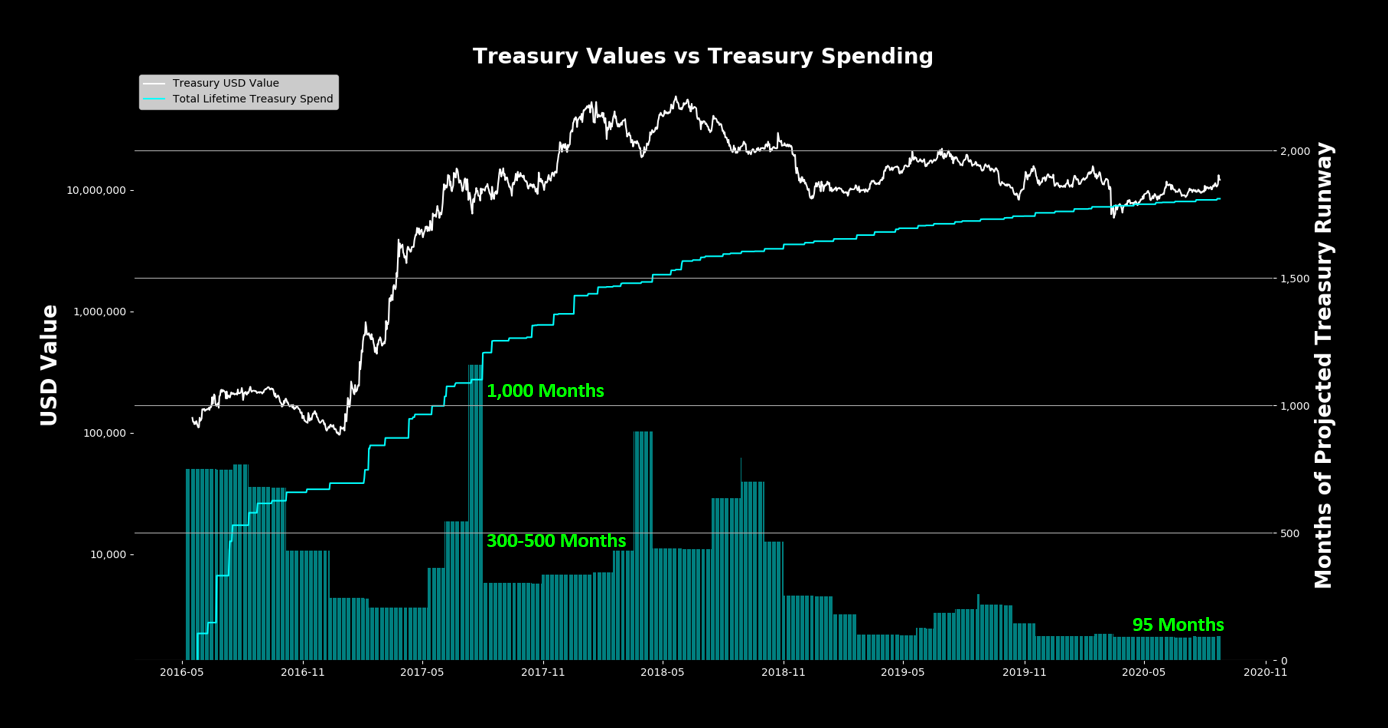
- At peak bull, the Treasury had over 1,000 months of projected runway, the equivalent of 80+ years of funding
- For the meat of the 2017 bull market, the Treasury ranged between 300–500 months of projected runway, the equivalent of 25–40 years of funding
- At current price levels, the Treasury has a projected 95 months of projected runway, the equivalent of 8 years of funding
DCR Treasury Returns
The final and overhanging question surrounding the Treasury and contracting remains: what has the ROI been on contracting work to date, and what can we consider reasonable? By comparing the USD value of the Treasury (white) and the total contractor pay through Decred’s lifetime, we can see at what multiple the Treasury is trading at versus the work its funding. After all — one of the goals of contracting work is to increase the value of the network, and in doing so, the Treasury.

- At peak bull, the Treasury was valued at a 60x multiple to the total Treasury spends
- At bear market lows, the Treasury was valued equally to the total Treasury spends
- The sweetspot for the Treasury-to-Spend multiple has historically landed between 10 -20x, which if revisited today, would imply a $135 Million Treasury valuation
Closing Out
Closing thoughts:
- We’re moving into a new distributed world, and DAOs with treasuries are likely to become a larger part of it
- Accounting and budgeting are going to become a necessary part of ultimately fulfilling a DAOs vision
- What’s interesting about DAOs + Treasuries is that the accounting data is always public, as opposed to other mission-driven collectives which only publish their accounting data as needed
- Accounting data always being public completely changes the game, as it opens the gate for building accounting tools to anyone and everyone (as opposed to needing to be hired to build the tooling in traditional accounting spaces)
- We are at the tip of this massive shift, and with its longstanding track record, my hunch is that Decred will be leading the charge
Until then — signing out,


Comments ()