

The Suppressor Part 2: On-Chain Analysis
Part 2 uses on-chain analysis to try and fill in some of these gaps. We begin our on-chain journey by looking at the DCR that was sold on DCRDEX and working our way backwards.

tacorevenge - Nov 3, 2021
Part 1 of The Suppressor series leaves the reader with a host of unanswered questions.
- How long has The Suppressor been operating in the DCR markets?
- Where did they get their inventory from?
- How much inventory do they have left?
- Who is behind The Suppressor?
- What is their motivation?
Part 2 uses on-chain analysis to try and fill in some of these gaps. We begin our on-chain journey by looking at the DCR that was sold on DCRDEX and working our way backwards. The largest source of DCR purchased on DCRDEX came from Binance, so naturally, the logical place to start is with Binance.
Binance
We can get an approximate estimate of the amount of DCR on Binance at any point in time by mapping out the Binance cold storage wallets, hot wallet, and known deposit addresses.
The way a typical centralized exchange works is that they provide users with one or more deposit addresses. A retail account will usually have a single deposit address, while institutional and miner accounts can be linked to many addresses.
The hot wallet serves as the aggregation point for moving funds between deposit addresses and withdrawal addresses. When you deposit DCR to your Binance account, it eventually ends up in the Binance hot wallet. As user withdrawal requests come in, chunks of DCR are sent out of the main aggregation address and used to satisfy withdrawal demand. These chains of transactions that are peeled off of the main aggregation address are referred to as peel chains.
Let’s look at an example. This is the aggregation address for Binance’s hot wallet.
https://dcrdata.decred.org/address/DsbtK3iQSNrN1d1m4EZV1YWNGW3RJ7fMgfR
You can see batches of DCR being sent into the wallet as well as batches of DCR being sent out, typically in quantities of less than 10,000 DCR. The inflows into this wallet are DCR from deposit addresses being aggregated. The outflows are peel chains used to satisfy withdrawals.
For example, a 3,000 DCR transaction being sent out of the hot wallet marks the start of a peel chain. User withdrawals will be peeled off of this 3,000 DCR until the balance becomes small enough that it needs to be merged into another peel chain. Several peel chains are typically running in parallel.
Since all of the DCR deposited to Binance eventually ends up in the hot wallet, an approximation of the total amount of DCR sitting in Binance deposit addresses can be calculated by indexing all addresses that have sent funds to the hot wallet at some point in the past. This group of addresses is what will be referred to as the deposit addresses.
Binance’s cold storage wallets are easier to understand. For security reasons, exchanges don’t like holding cryptocurrency in hot wallets if they don’t need to, so they’ll periodically send idle cryptocurrency into cold storage. They’ll only access the cold storage wallets if withdrawal demand outpaces the amount of funds available in their hot wallet. Here are Binance’s cold storage addresses:
https://dcrdata.decred.org/address/Dsm6Pdy6tC9C5y3r94yfSpBYbVVneErLtbg
https://dcrdata.decred.org/address/DsmjtBxvbgagxd4Uz44WrRJitq2gDnwY5es
Now that you have a basic understanding of how exchanges operate, you can see how an approximation of the Binance inventory can be calculated.
Inventory = Deposit Address Amounts + Hot Wallet Amount + Cold Storage Amount
Historically, the Binance cold storage balance has been over 300k DCR with the hot wallet and deposit addresses fluctuating in the range of 70–110k DCR. More recently, the cold storage balance has fallen to 228k with the hot wallet and deposit addresses settling in the range of 25k-40k DCR.
The Binance analysis by itself doesn’t really tell us much. The question that needs to be answered is where all the DCR that ends up on Binance is coming from. This is a much harder question to answer and requires a more in-depth analysis.
Cluster Analysis
The best way to map out the source of the DCR flowing into Binance was to use cluster analysis. Entities with large on-chain footprints, such as exchanges, can be mapped out by grouping all known addresses that are associated with that entity into a cluster. Once you’ve identified the various clusters, you can start looking at the interactions between clusters and work your way backwards in order to trace the origins of the DCR.
This cluster analysis focuses on two main types of DCR clusters:
- Miner clusters
- Exchange clusters
Exchange Clusters
Clusters were built for the following exchanges (alphabetical order):
- Binance
- Bitcoin.com / HitBTC / Changelly
- Bitfinex
- Bittrex
- Bitvavo
- Bleuttrade
- Cobowallet / Oceanex / MEXC
- CoinEx
- Exodus
- flyp.me
- Gate.io
- Huobi
- i2 Trading (OTC)
- Kucoin
- Lykke
- OKEx
- Poloniex
- Upbit
- XTExchange
If a cluster contains multiple exchanges is means that the exchanges share a single DCR wallet on the backend. For example, if a user deposits DCR onto both HitBTC and Changelly, the DCR from those deposits will end up moving through the same hot wallet.
The analysis was never able to track down a DCR deposit address or withdrawal transaction that could be used to confirm the Upbit cluster. This cluster was built using the best available information at the time, but may require some error correction.
Analysis Parameters
The analysis defines cluster-to-cluster volume as DCR that moves from cluster A to cluster B without hitting any other known clusters. The number of intermediary hops (i.e. transactions) that it takes to move from cluster A to cluster B can vary.
The analysis looked at the on-chain data over a year long period from 1 October 2020 to 1 October 2021. The DCR inflation over this period is listed below.

The initial goal of the cluster analysis was to map out the DCR that flowed into Binance and out of Binance over the year long period.
Binance Cluster
All figures are quoted in thousands of DCR. 1,000k DCR = 1,000,000 DCR
Deposits


Withdrawals

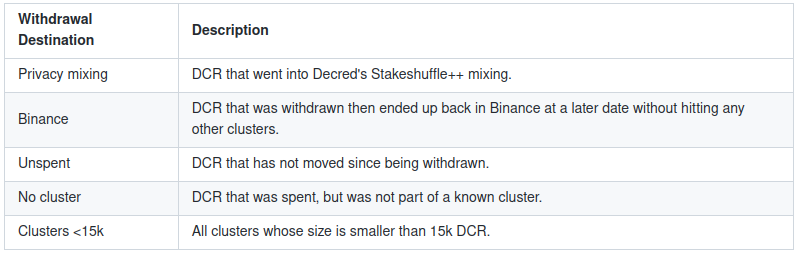
The vast majority of Binance withdrawals end up being transferred to and sold on DCRDEX. This will come as no surprise if you’ve read Part 1 of this series.
It’s also likely that a large portion, if not all, of the 475k DCR that was withdrawn into privacy mixing eventually ended up on DCRDEX as well. 510k DCR was sold on DCRDEX that came directly from privacy mixing over the same period of time.
Huobi Cluster
A data point that sticks out is the DCR flows from Huobi to Binance. Huobi operates out of the Seychelles now, but was originally a China based exchange. Very little DCR is actually traded on Huobi, which is why these flows are so odd.
How can there be 640k DCR, more than any other centralized exchange, moving from Huobi to Binance? Where is it coming from?
A high level analysis of the Huobi cluster revealed that Huobi saw 768k DCR in deposits over this period. 305k (40%) of these deposits traced directly back to PoW reward.
Now that we have a decent overview of the data, let’s start diving into what it actually means.
Decred PoW Miners
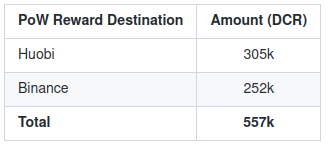
805k DCR was minted and claimed by the PoW miners during this period as their reward for mining blocks. During the same period, 557k DCR was sent to either Huobi or to Binance that directly traces back to being PoW block reward. This suggests that, at a minimum, 69% or more of the PoW reward is being sold onto exchanges soon after it’s mined.
When you account for the 521k DCR in PoS reward that was also sent to Binance by PoW miners, you have a combined selling of 1,078k DCR. The PoS reward sent to Binance by the miners accounts for 43% of all PoS reward that was sent to Binance during this period.
It should be noted that these numbers only include the DCR that directly trace back to a PoW miner cluster without touching any other known cluster. If you look at the DCR flows into Binance, you’ll notice there are quite a few exchanges that have negligible DCR trading volume, yet have DCR flowing from their exchange to Binance on a regular basis. The speculation here is that the PoW miners are using these small exchanges as intermediary hops as a way to obfuscate the origins of the DCR that ends up on Binance. The largest example being the DCR flows from Huobi to Binance. 1,078k DCR is a large amount of DCR, but it could only represent a portion of the total DCR that PoW miners are selling. Further analysis of the deposits into these smaller exchanges would need to be conducted in order to verify this claim.
The PoW miners have been referred to as a singular group throughout this analysis so far, but this is not entirely accurate. We need more context in order to understand their motives. Who are these PoW miners? How many are there? How geographically distributed are they?
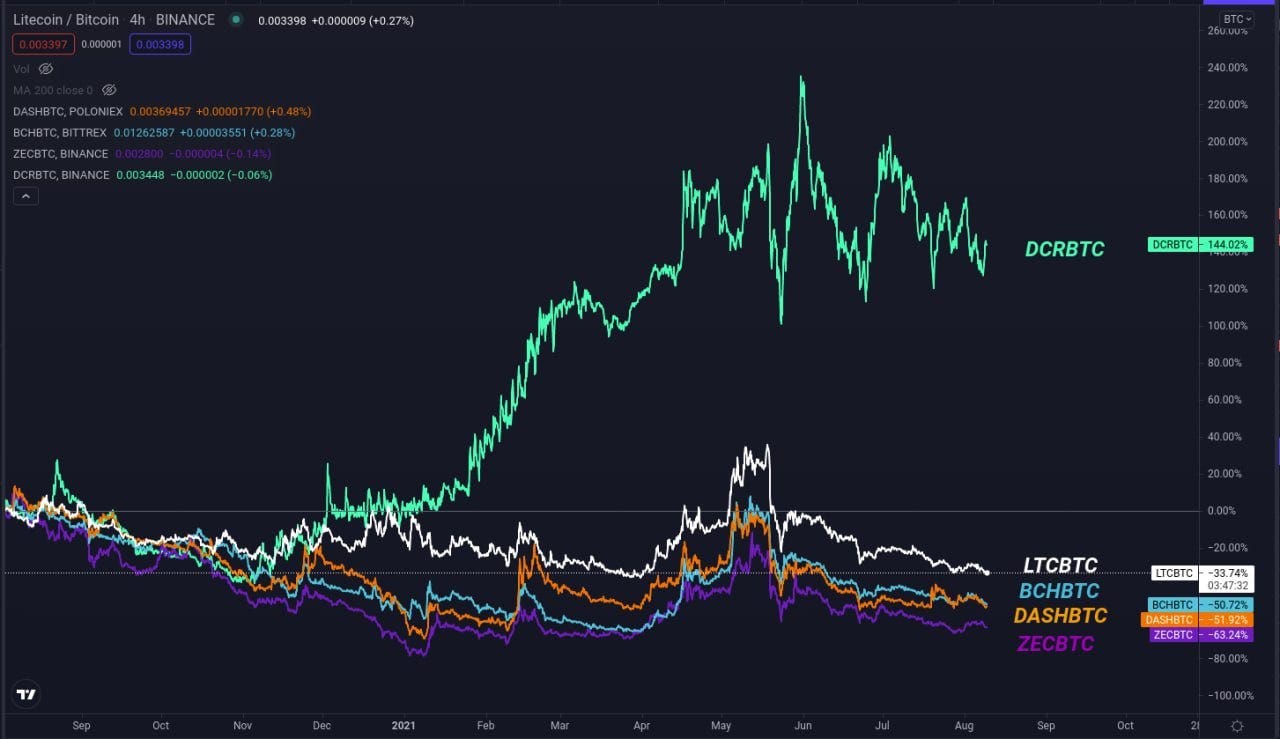
This information is not readily available since it’s not like these miners are publicly traded companies, but a telling data point was revealed when Decred’s hash rate dropped earlier this year, from April to July, as miners were forced by the CCP to leave China. Let’s take a look at some of the temporary hash rate changes that occurred for various PoW cryptocurrencies during this period.

Decred saw a massive hash rate drop of -85% over this period, the largest recorded change among the major PoW coins. This is a strong indication that Chinese miners, possibly a single entity or small group of entities, control the vast majority of Decred hash power.
This is also supported by the fact that Decred’s price has appreciated 10x to 25x during this cycle, yet the total network hash rate has not seen similar increases. In fact, it’s actually gone down. The hash rate at $10 DCR was ~35% more than the current hash rate at >$100 DCR. In theory, hash rate should be increasing as price increases. The increased value of the block reward is able to support a higher level of investment from the PoW miners and competition among them should lead to this investment being made, but if you’re an ASIC miner that already has the market cornered, why would you?
To summarize, this analysis finds that:
1. The majority of the PoW block reward is being sold onto the market as it’s mined (69% or more).
2. A substantial part of the PoS reward that ends up on Binance is coming directly from the PoW miners (43%).
3. The PoW miners appear to be using smaller, intermediary exchanges as a way to obfuscate the origins of the DCR that ends up on Binance.
4. The hash rate drop off during the China exodus (-85%) and recent ASIC market dynamic suggests that the PoW miners are a single entity or a small group of entities.
The PoW miners are still operating within the bounds of the Decred consensus rules, so why does this matter? Isn’t this the market working as intended?
To understand just how harmful this behavior is, we must first take a look at Bitcoin’s PoW mining.
Bitcoin PoW Miners
Bitcoin pioneered PoW and, as a result, has benefited from a phenomenon that has proven difficult for other PoW cryptocurrencies to replicate. Bitcoin miners become holders during bull markets, helping to create the supply squeezes that fuel Bitcoin’s parabolic rises.
Bitcoin’s earliest days are marked by a hash rate that was the equivalent to just a single 2008 era CPU. 1.5 to 2 million BTC were mined during this era, a large portion of which are attributed to Satoshi and still remain off the market to this day.
Next came the era of early adopters CPU mining BTC. These are the die hard believers that bought into Bitcoin’s vision when it was still just a crazy idea. Commoditized PoW mining as it exists today would have been a foreign concept to this group. These miners are long term holders that saw the big picture before everyone else.
As the industry professionalized, PoW mining moved from CPUs (2009–2010) to GPUs and FPGAs (2010–2013) to ASICs (2013 — present).
BTC was still a niche and highly speculative asset at the time of these shifts. The person that would have been willing to invest time and money into the specialized hardware and software required to mine BTC during this period is going to be a believer in the long term potential of the project. Again, BTC miners are the original long term holders. In more recent years, miners still hold BTC on their balance sheets as a way to play the cycles. On-chain analysts have attempted to quantity this behavior through metrics such as miner unspent supply, miner balance, miner net position change, and miner to exchanges.
This doesn’t mean that BTC miners don’t sell, it just means that they play a role in creating the supply constraints that help fuel Bitcoin’s parabolic rises. These parabolic rises are the defining feature of Bitcoin’s market cycles and these market cycles are what allow Bitcoin to continue to attract new developers, community members, and media attention. Bitcoin’s PoW miners have played a significant role throughout Bitcoin’s history in creating the positive feedback loops that we see play out during bull markets.
Some might attribute these positive feedback loops to Bitcoin’s four year halvening schedule. While this is a common narrative, it’s an overly simplistic narrative. Other PoW cryptocurrencies, such as Zcash, have the same four year halvenings, yet have not been able to achieve the same type of price cycles. The halvenings certainly play a role in aligning investor expectations and helping setup the conditions for a supply squeeze, but as charts like Zcash show, the halvening by itself is not enough to create sustained price appreciation.
The question that other PoW cryptocurrencies should be asking is, what would BTC’s price history look like if the PoW miners had treated mining as a commoditized service, immediately sold all of the coins they mined, and did not act as holders during parts of the cycle? This is the reality that most other PoW projects face. Instead of creating positive feedback loops, constant sell pressure from PoW inflation depresses the price and makes it difficult to break out of cyclical downtrends. The holders get demoralized, leading to more sell pressure. A negative feedback loop is created.
Part 1 documents how Decred tried to break free from this negative feedback loop and, in the process, uncovered the data that lead to the publication of these blog posts. The behavior that has been observed in the DCR markets suggests that a sophisticated operation is on the other side of it. An operation that, once developed, could potentially be deployed against a variety of PoW projects. This analysis does not have the resources to look into these other projects, but a quick glance at the hash rate correlations during the China exodus and at the price correlations between these PoW projects might suggest that Decred is not the only project battling this hidden enemy.
Conclusion
If Part 1 was able to convince you that the intent behind the unusual behavior witnessed in the DCR markets is malicious, then the natural conclusion after reading this analysis is that the Decred PoW miners are malicious and are using the block reward from both PoW and PoS to attack the project.
Even if you weren’t convinced by Part 1, the glaring differences between the supply dynamics created by the Bitcoin PoW miners compared to the Decred PoW miners and the negative consequences it has for the project can’t be ignored.
From a cursory glance, this behavior does not appear to be limited to just DCR. The similar hash rate fluctuations during the China exodus and similar price action over the years suggests that this might be occurring on a large number of cryptocurrencies that launched during the PoW era.
Could the PoW industry actually be controlled by the miners that were early pioneers of PoW and were able to established dominance through network effects?
Could China’s cheap hydroelectric energy have helped these miners establish a monopoly?
Could the current realities of the chip manufacturing industry still be fueling this centralization?
These are questions for another time…
That wraps up Part 2 of The Suppressor series. I hope you’re left with a deeper understanding of the market dynamics at play in the DCR markets, an area that has traditionally been opaque and known only to a small handful of insiders. Tune in to Part 3 as we speculate on the potential motives of The Suppressor.


Comments ()