


Crypto still looks terrible right now! The markets are likely going to pull back but if you're a bull it could present one last solid buying opportunity
Obligatory: this is not financial advice and I am not a financial advisor.
The markets have been incredibly boring the past few weeks after a run up that gave us some hope. We're now at a precarious area where the moves could be powerful whichever direction they take.
VIX (S&P Volatility Index)
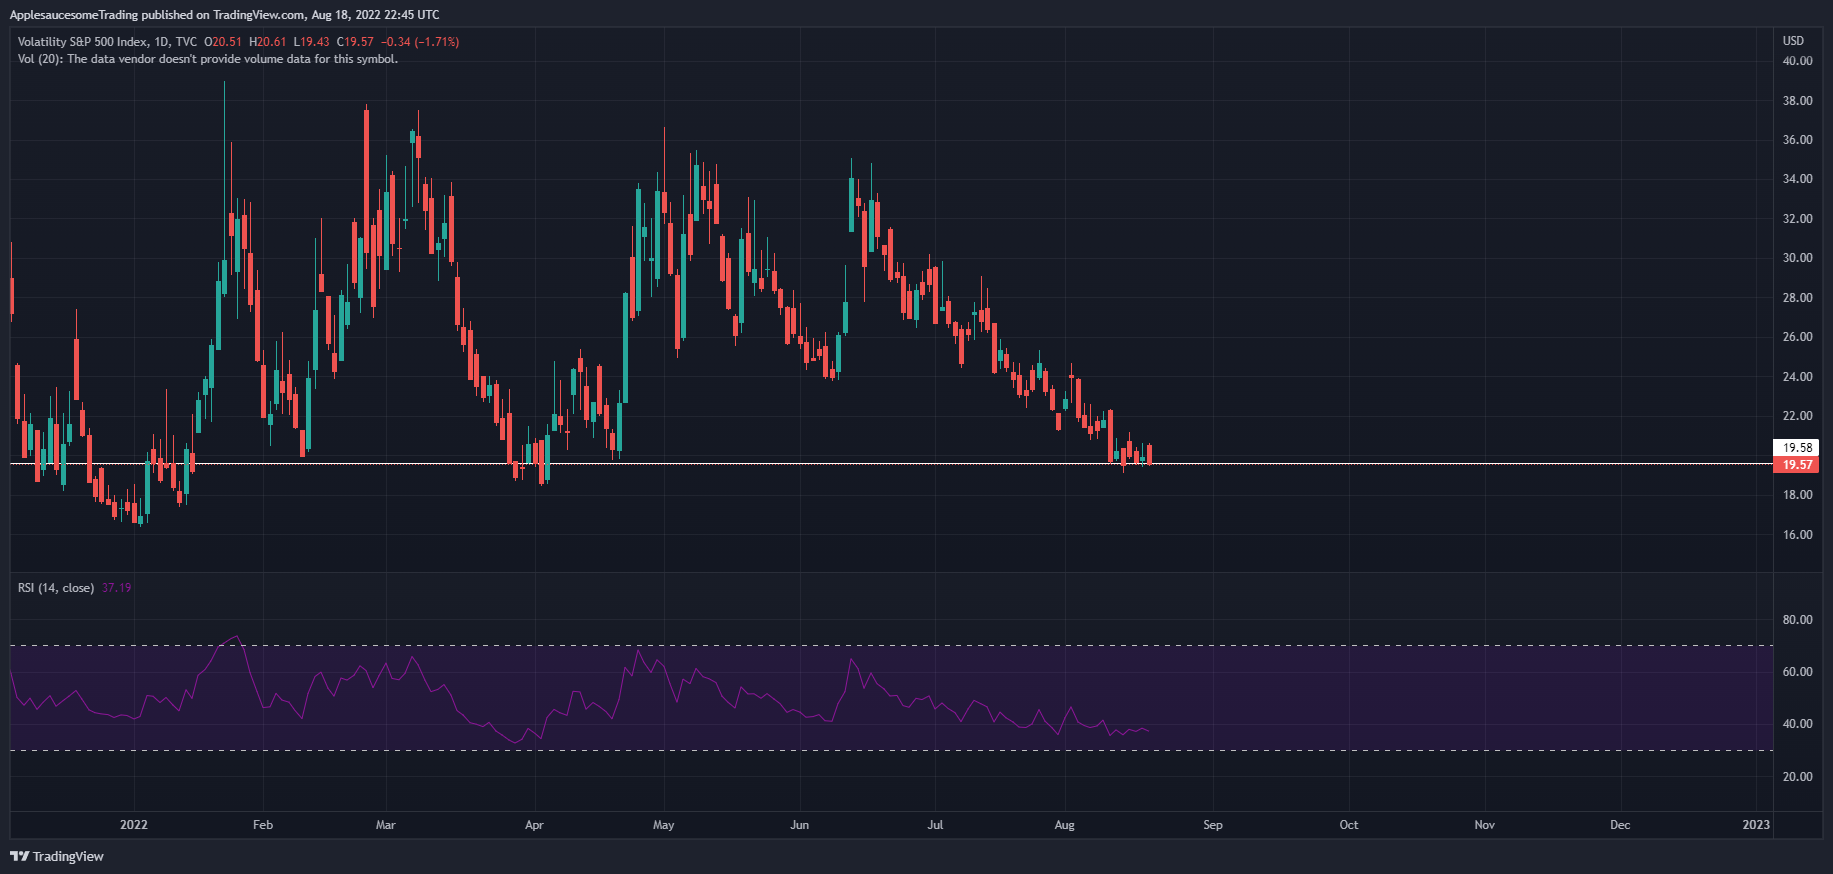
The VIX sustained a solid downtrend which sent the S&P into a very nice relief rally. Right now it's bottomed out at support where it's likely to bounce and send the markets back down.
DXY (US Dollar Index)
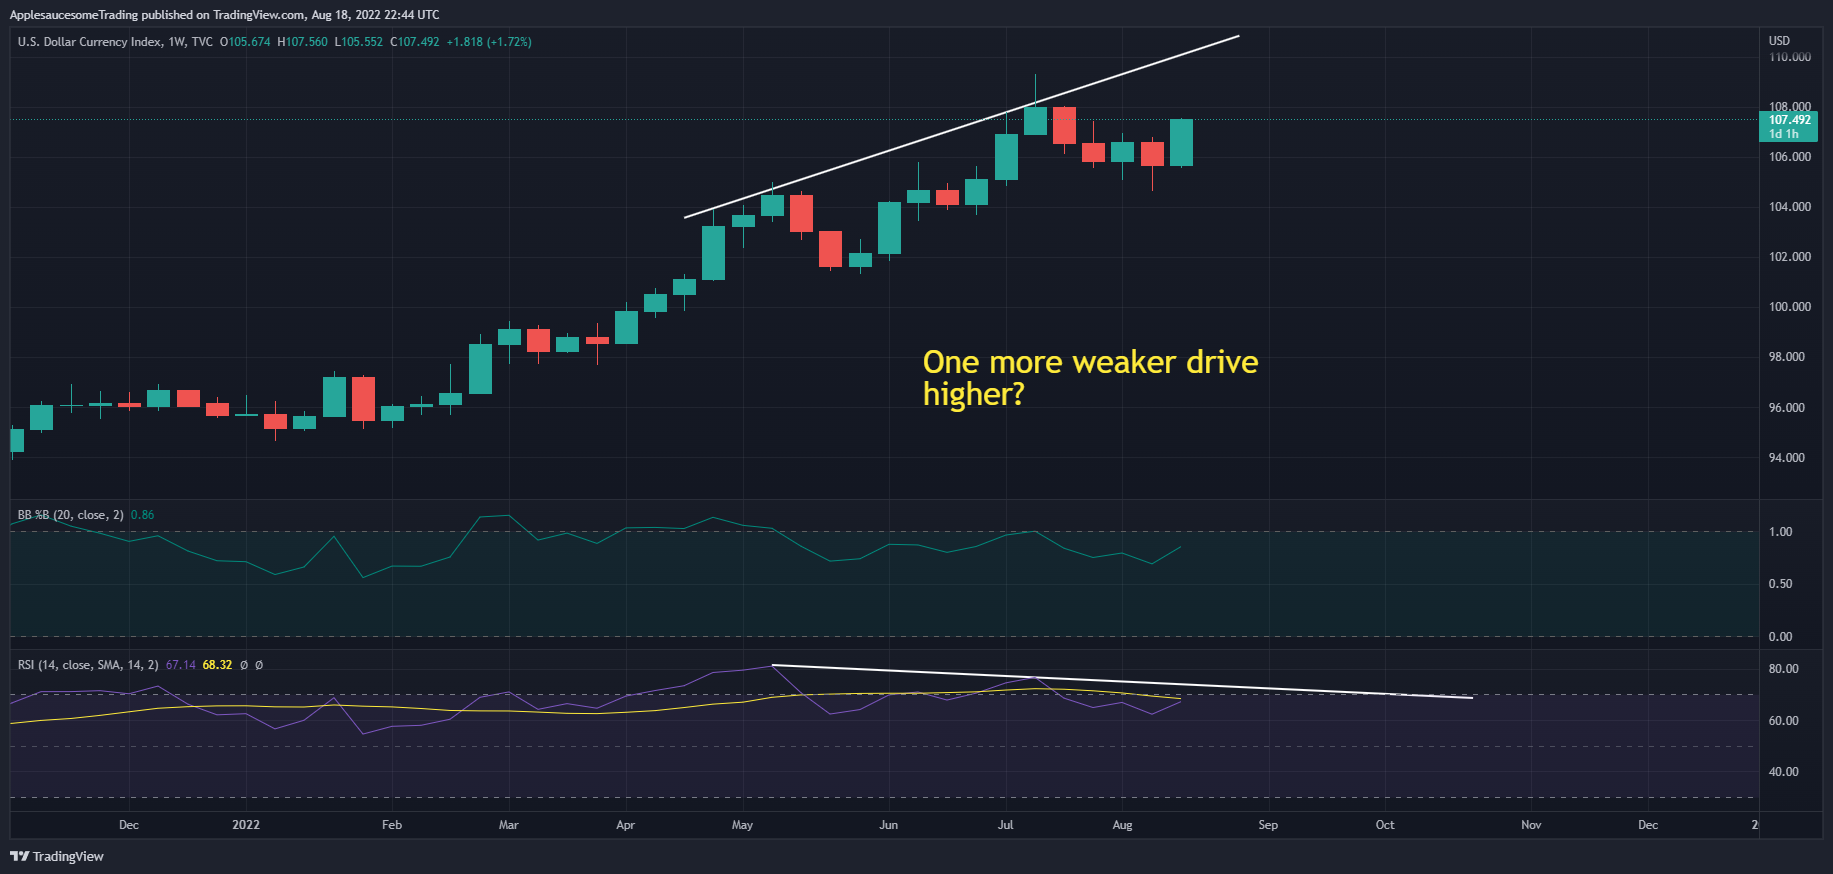
After weekly bearish divergence played out the past few weeks but there's one more potential rally that it could be going for. I've seen it many times where there is a third rally on continued bearish divergence. Sort of like a death gasp where the price gives one last rally before it dies. I'd actually prefer it this way since it would give me one last buying opportunity and give more certainty for a reversal.
S&P
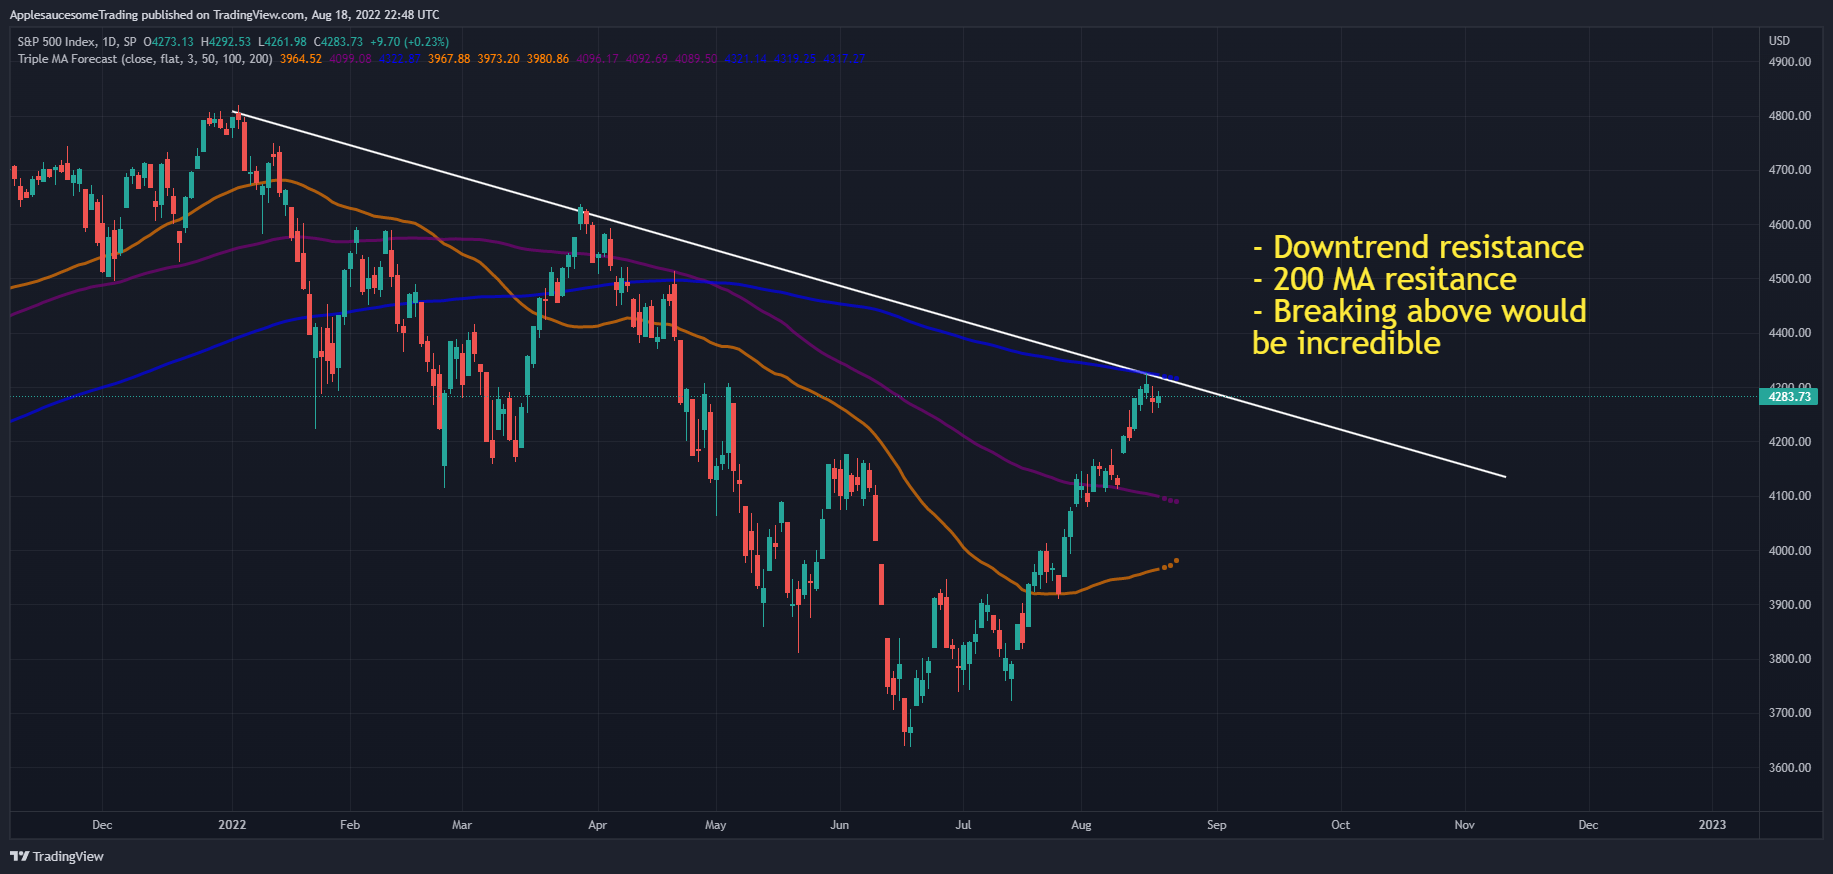
As we can see here the VIX's sustained downtrend reflects the S&P's rally the past few weeks. We're at a very precarious point of inflection right now which is why I think there hasn't been any strong rallies yet in crypto. We're at logical resistance due to hitting the daily 200 MA as well as the macro downtrend line. I expect us to see a retracement of some sort, maybe even back to the 100 MA. If we don't hold support there then things could get really bloody.
BTC

There's two side of Bitcoin that I'm seeing. Both look terrible but one looks less terrible.
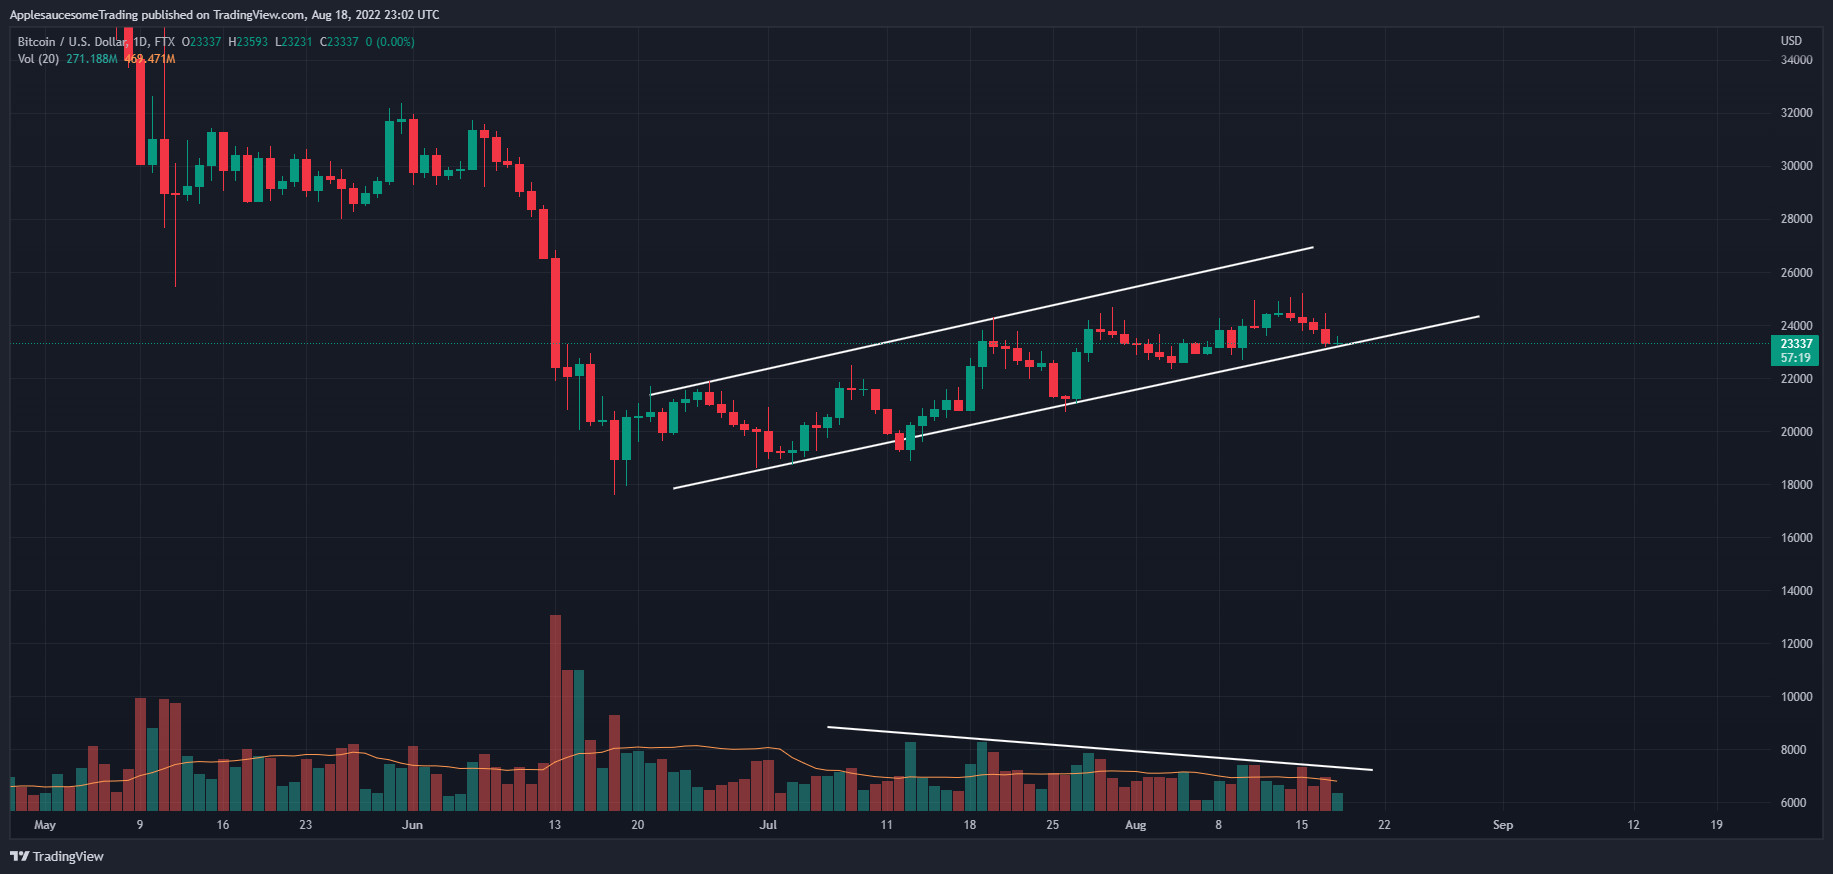
On one hand, on FTX, Bitcoin looks like it's in a massive bear flag and wants to dive to $10,000
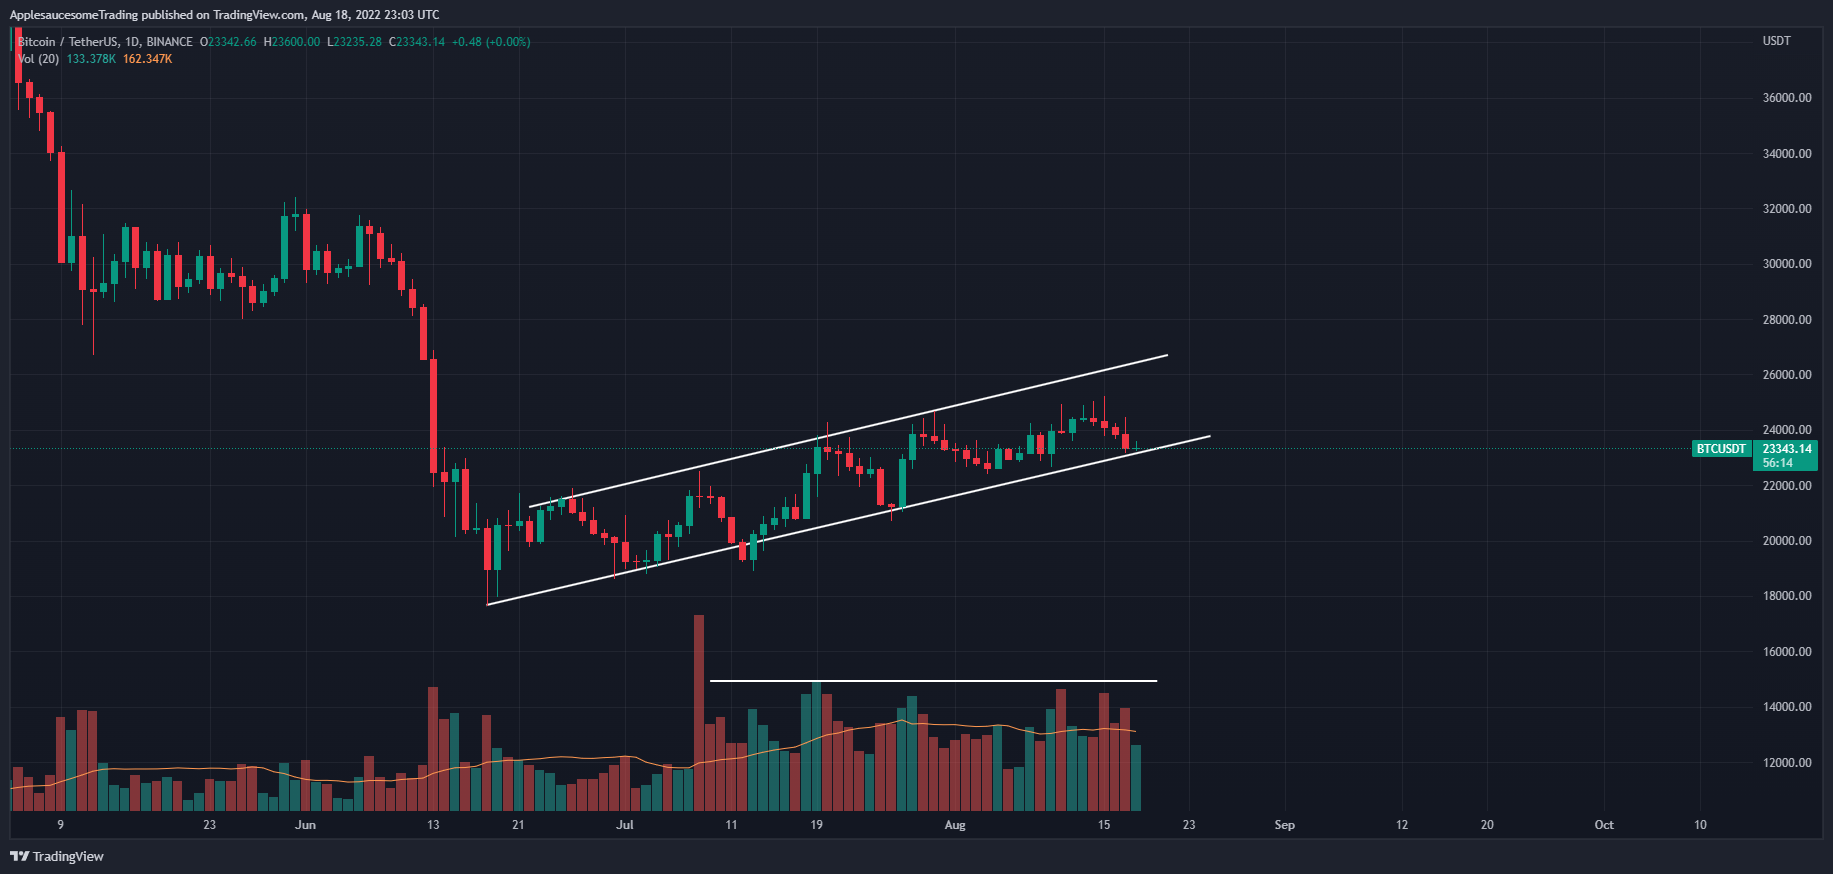
On the other, on Binance, it looks nothing like a bear flag because of the volume profile. Binance's BTC/USDT pair has the highest Bitcoin volume of any market and any pair. I honestly have a hard time believing Bitcoin could go to $10,000 so I'm biased towards this chart rather than FTX's derivative trading.
DCR
Decred had a massive ~160% pump a few weeks back. We've retraced most of it as expected but there's some levels that I'm looking out for and some interesting data to look at when we zoom out.
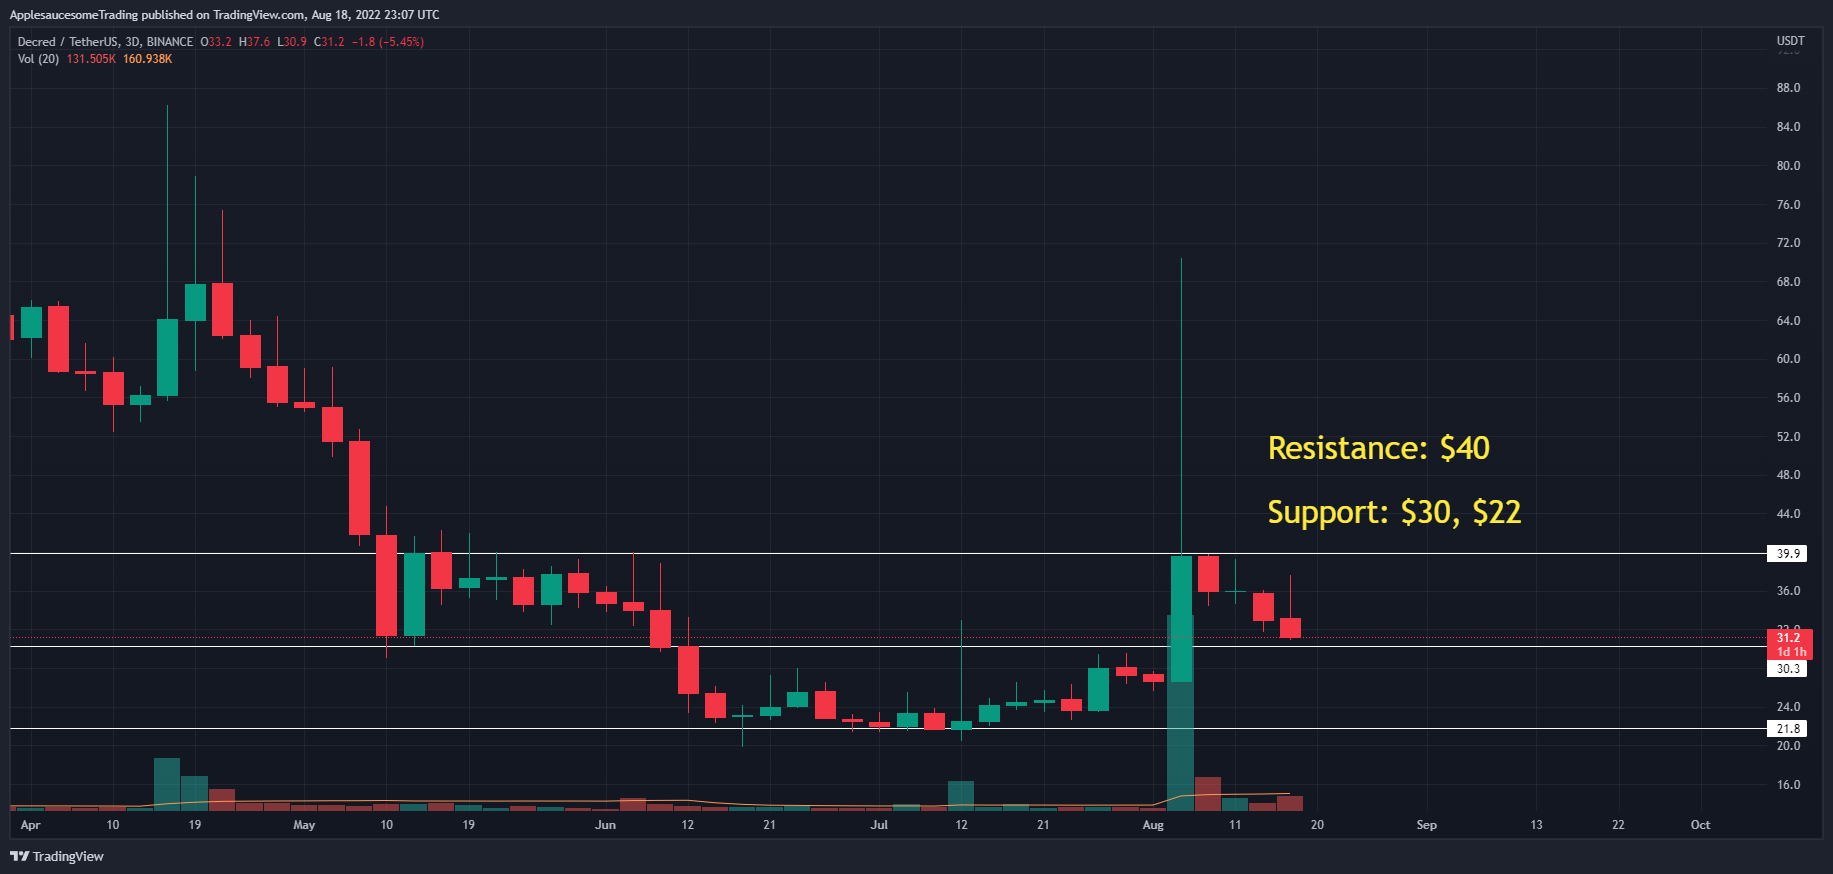
We can see that $40 will be the resistance to beat and a significant signal when we break above it. The next supports where I intend to DCA between are $30 all the way down to $22.
Next I'll be going through some interesting data points from that pump.
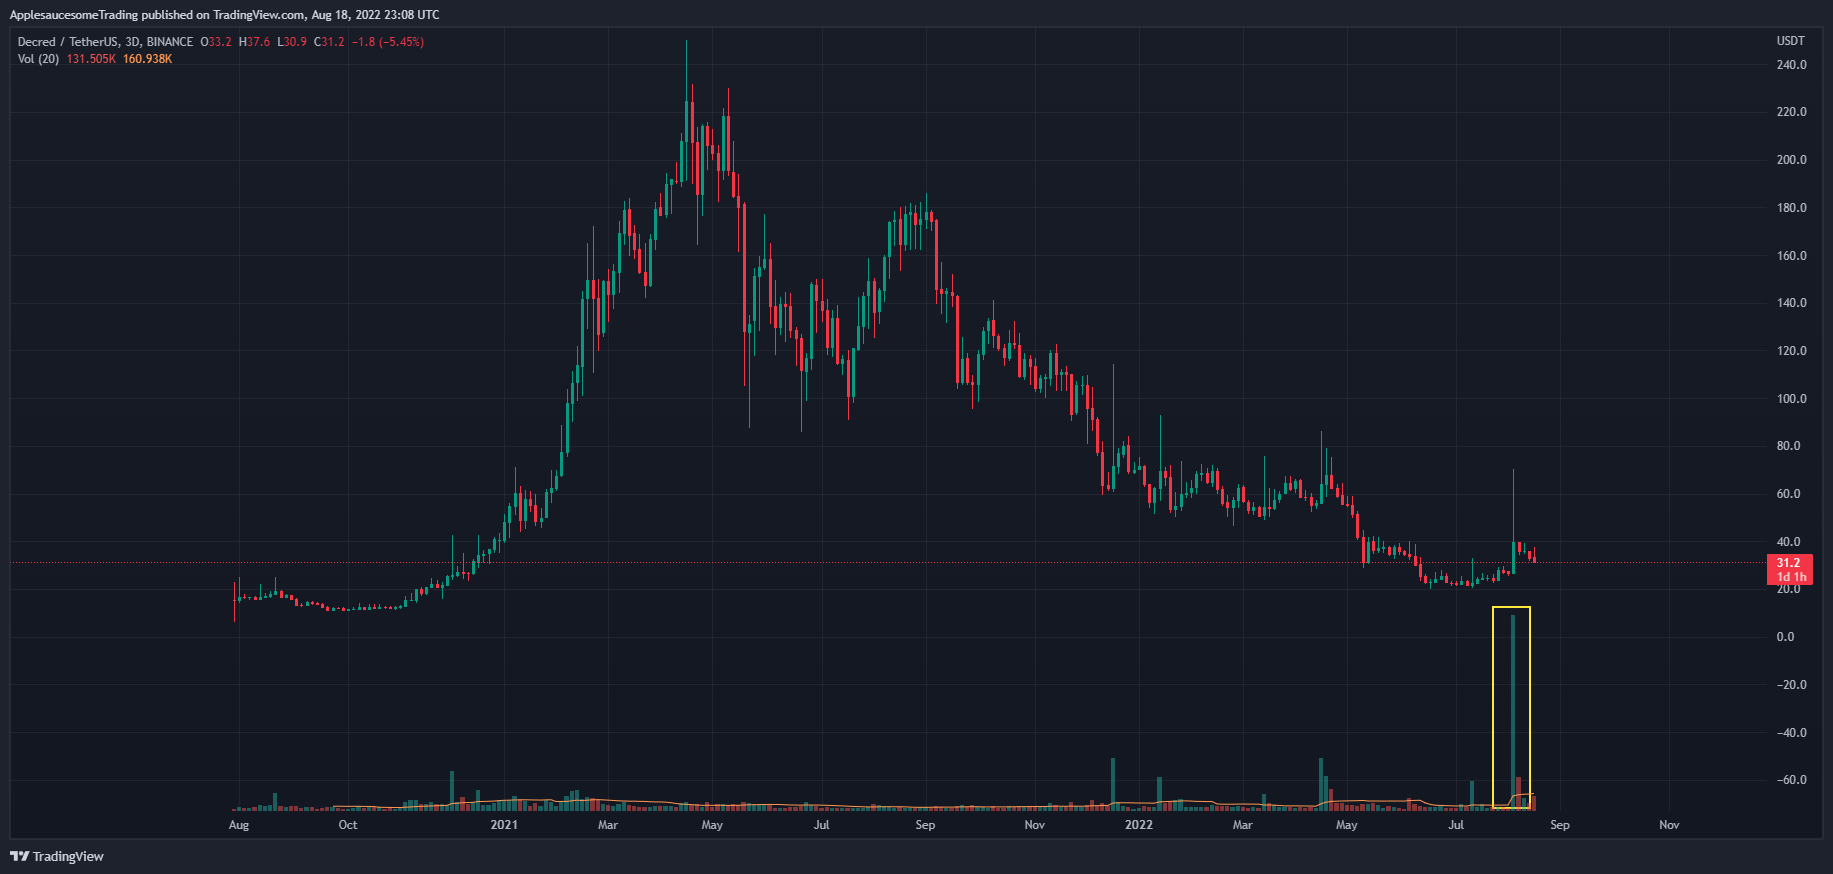
The volume of that candle was massive. And I mean MASSIVE. Just on the DCR/USDT pairing there was nearly 2 million DCR traded back and forth. That's 14% of the entire supply. Note: This doesn't mean that much was bought or sold but the total combined amount bought + sold.
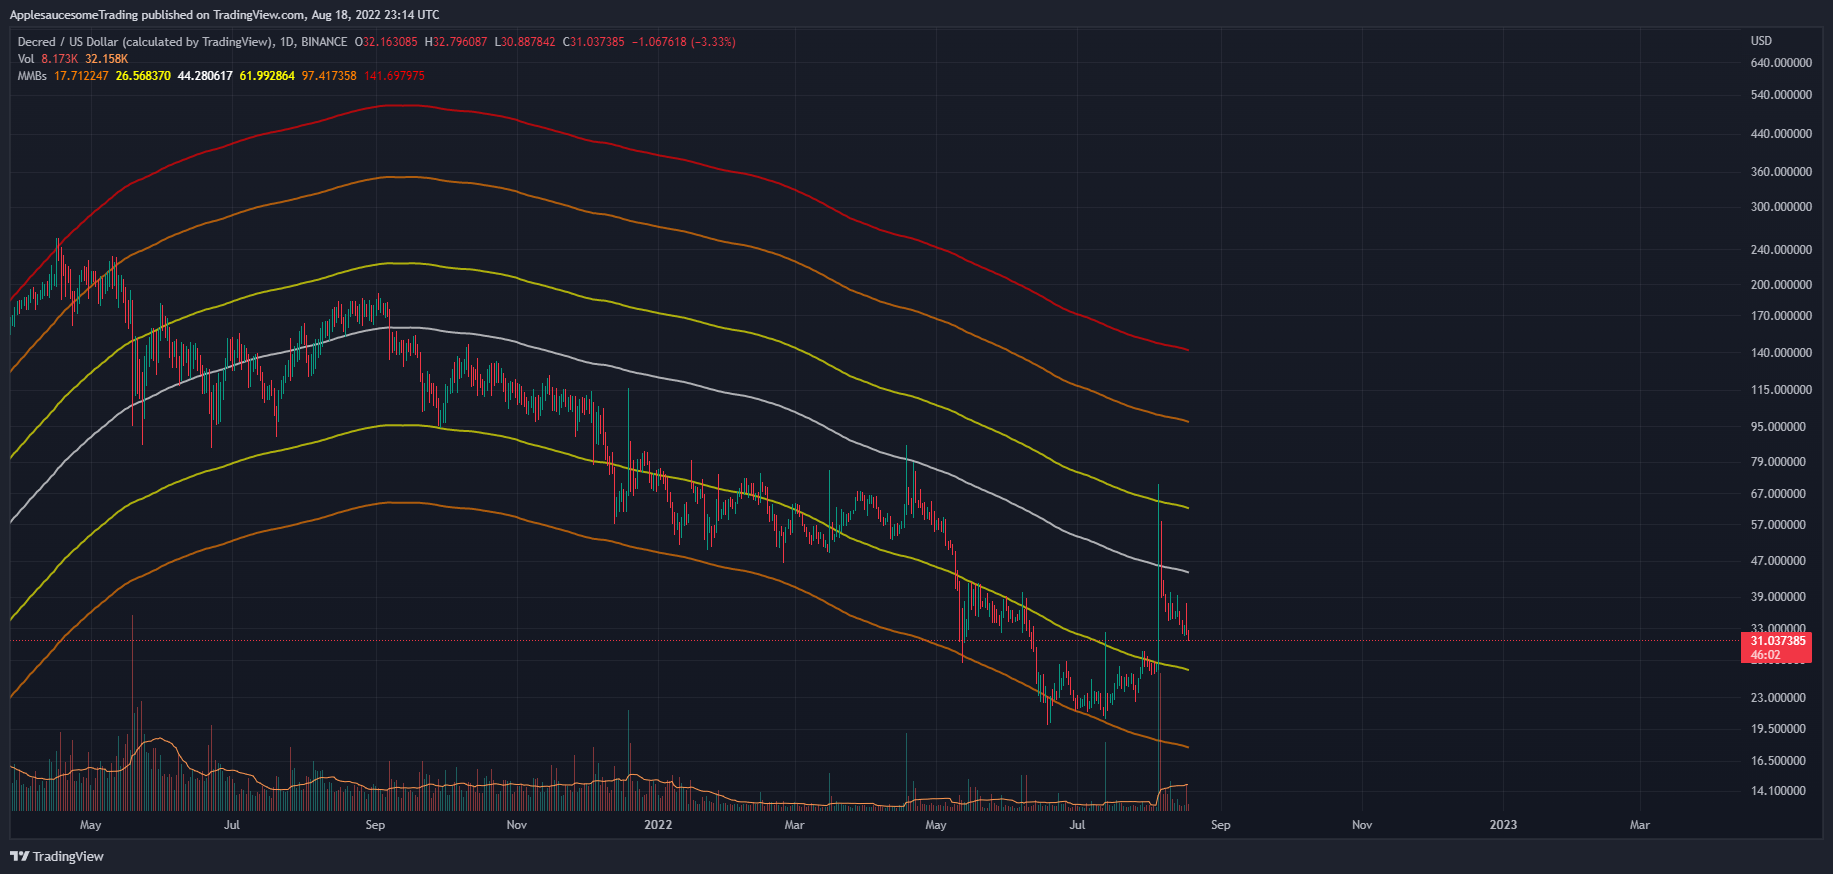
We can also see that the mayer multiples are being interacted with. The pump was initiated right below the yellow bottom band and if we retrace further then I would expect to see support on it.
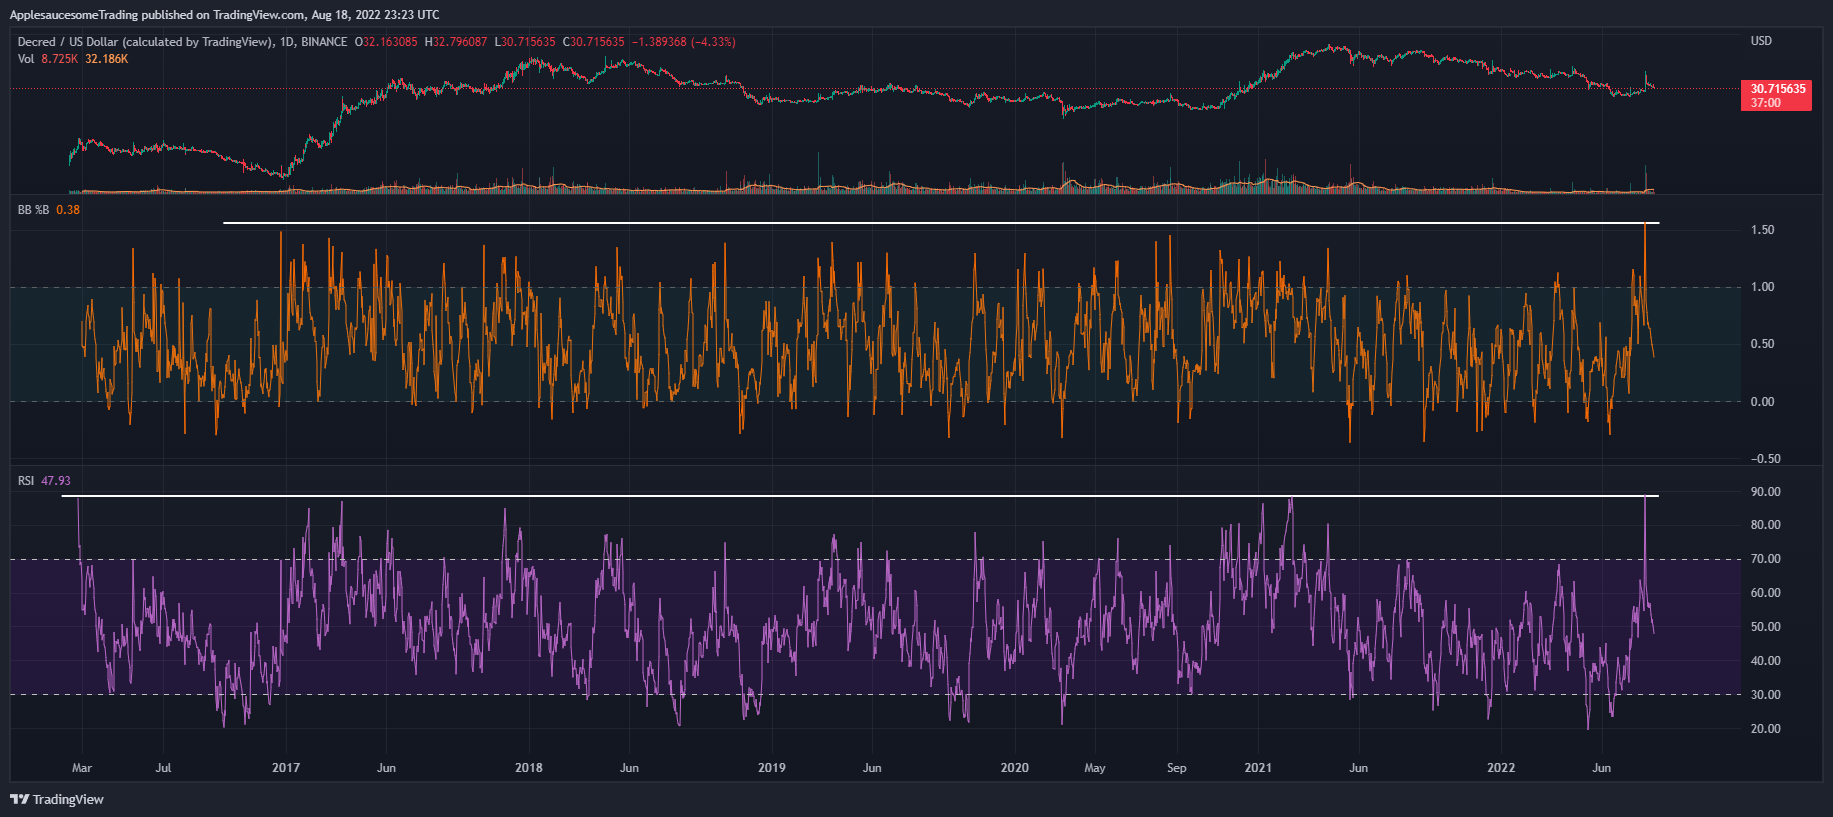
What's even more interesting to me is that the daily candle set a new historical record for BB% and RSI. There has never been a stronger move than that one in Decred's existence.
In conclusion, the markets are likely going to pull back but if you're a bull then it could present one last solid buying opportunity. If you're a bear then this would be the time to sell more. Crypto still looks terrible right now but I'm not selling. Decred will probably fully retrace but there's someone with deep pockets paying attention to it. The TA that the candle smashed through is insane.


Comments ()