

Decred On-Chain: Strongest Hand Market Cap + Ratio
Valuation is a topic of great debate within the cryptocurrency space, likely because these networks sit within the grey space between being money and a firm

Permabull Nino - Apr 3, 2020 - A Tool for Tracking Implied Value Over Shorter Timeframes

Previous Work + Takeaways
Decred’s on-chain data is wide-ranging and increasingly well documented. If the reader finds any issues understanding the discussion covering “The Strongest Hand Market Cap + Ratio”, it might be helpful to backtrack and digest other available pieces on relevant subject matter.
However, the abbreviated version of research and conclusions within the “Decred On-Chain” domain includes the following:
(1) Decred On-Chain: A Look at Block Subsidies
- Public ledgers are digital entities that leverage block rewards to incentivize / bootstrap growth
- Block rewards are fundamental to network valuation
(2) Decred On-Chain: The Ticket Pool VWAP
- Cost basis that flows within the proof of stake ticketing system impacts user behavior and ultimately reflects itself in short / long term price action
(3) Decred On-Chain: HODLer Conversion Rates
- DCR flows dominated by HODLers, marginal buyers, and marginal sellers reflects itself in short / long term price action
(4) Decred On-Chain: Ticket Funding Rates
- User sentiment is reflected in ticket price fluctuations and their corresponding returns
This piece will aim to prove a few simple points:
The largest instances of Decred ticket purchases establish the maximum willingness to hold for network participants, and this threshold can provide users with an on-chain implied valuation for the network.
Further — this on-chain implied valuation can at times differ greatly from the market-traded network valuation, leaving room for corrections back to a “fairer price”.
The journey to this conclusion goes as follows:
(1) Valuation Models in Crypto
(2) Decred Ticket Volumes = Demand Surplus
(3) Defining Valuation Using Tickets
(4) Calculating Strongest Hand Market Cap & Ratio
(5) Charts, Explanations & Takeaways
(6) Additional Considerations
(7) Conclusion
Valuation Models in Crypto
Valuation is a topic of great debate within the cryptocurrency space, likely because these networks sit within the grey space between being (1) money and (2) a “firm” (i.e. a profit / mission-driven collective).

Most are looking for a “silver bullet” so to speak, hoping one model will provide the answer to all valuation problems. The author argues that the unique positioning of cryptocurrencies naturally makes the valuation dilemma quite nuanced, and best viewed with a two-pronged, combination of:
Network-Based Valuation Tools: Tools which leverage consistent, network-driven data (i.e. block rewards) to build valuation models for cryptocurrencies.
- These valuation models are generally unresponsive to short term activity and maintain an upwards + to the right curve
- Most popular explorations of this are Plan B’s Stock-to-Flow model within the Bitcoin space, and Checkmate’s analysis + application of these principles within the Decred realm

User-Based Valuation Tools: Tools which leverage less predictable, user-driven data (i.e. on-chain transacting) to build valuation models for cryptocurrencies.
- These tools are responsive to short term on-chain activity and tend to oscillate over time
- The most popularly known tool in this category is the NVT Ratio, coined by Willy Woo and Chris Burniske

When these two toolsets are mixed, we get a long term trend that needs to be respected (network-based valuation), with oscillations around the long term trend driven by short-term adoption / emotions (user-based valuation):

Long story short:
- Network-based valuation tools provide few signals per market cycle due to their directional nature
- User-based valuation tools provide many signals per market cycle due to their oscillating nature
- It’s important to look at both valuation methods as they’re both relevant, just over different time horizons
Decred Ticket Volumes = Demand Surplus
The Strongest Hand Market Cap + Ratio is a valuation tool driven by on-chain DCR ticket flows, and is thus a user-based valuation tool. There are a few things that make Decred’s tickets particularly useful for building shorter term valuation tools:
- Decred ticket volumes gauge on-chain “net demand” for DCR. There is no sell-side to DCR tickets — users “sell” by just opting out of ticket purchases. Thus, tickets represent an incredibly clean means to track demand surplus for DCR

- Decred tickets are time-locked, and thus reflect high conviction net demand for DCR
- Decred tickets reliably adjust in price every 144 blocks (as opposed to other staking methods which do not adjust stake difficulty). This adjustment ensures that ticket prices (and thus, ticket volumes) accurately reflect the market’s demand surplus to HODL DCR
- These three factors combined make tickets a high-signal data point for short term valuation modeling when compared to other means such as standard on-chain transacting
Defining Valuation Using Tickets
Now that the above has been established, the core pieces to the rationale for the Strongest Hand valuation toolset require explanation:
- The value of something is a function of the demand to hold it
- The demand to hold something is determined by the highest bidder
This logic is simple and straightforward — now it needs to be translated into DCR-speak.
- The value of Decred is a function of DCR ticket volumes
- The demand to hold DCR is determined by the highest daily ticket volume (288 blocks of ticket purchasing) within a window of time
These principles will be further fleshed out and implemented in a formulaic fashion in the section below…
Calculating Strongest Hand Market Cap & Ratio
In this section we will calculate the Strongest Hand Market Cap and Strongest Hand Ratio. Following the calculations, a brief explanation will fully tie in the logic from the two previous sections before moving onto charts.
As some readers may already know, on average it takes 28 days to fill up the ticket pool, and 142 days for an unvoted ticket to expire. These times periods also represent a good spread between short and medium term trends, so we will use these special Decred numbers for calculating two different sets of Strongest Hand values. The 28-Day and 142-Day Strongest Hand Market Caps are calculated below:

To finish things off, the Strongest Hand Ratio is calculated below:

Rationale:
- Max_Vol: The maximum USD value that has gone into tickets (measured on a 288 block basis or two ticket windows) over the previous 28 or 142 days
- 28 Multiplier: The number of 288 block periods it takes (on average) to fill up the ticket pool
- The Strongest Hand Market Cap is in reality an implied ticket pool value (denominated in USD)
- This “implied ticket pool value” takes the largest 288 block ticket buying instance over a 28 or 142 day period, and assumes the entire ticket pool was filled with 27 more identical periods of ticket buying
- Decred Ticket Pool = Aggregate Demand Surplus for DCR
- Aggregate Demand Surplus for DCR which is defined by the highest bidder over 28 or 142 days = Strongest Hand Market Cap
- This calculation isn’t performed on a DCRBTC basis because it hasn’t proven to give quality signal — likely as a result of the fact that valuation vs BTC is difficult given its volatile nature
Charts, Explanations & Takeaways
The value from the Strongest Hand Market Cap in charts is best extracted via ratios, then these ratios can be built out into historical overvaluation / undervaluation bands. This approach, with accompanying analysis, is included below:


The takeaways from the charts above are:
- 28-Day Strongest Hand Ratio is more responsive and identifies micro tops and bottoms, which at times coincide with macro tops and bottoms
- The 142-Day Strongest Hand Ratio is less responsive, but higher conviction as it has successfully identified the macro tops and bottoms since August 2017
- Something that is unique about this tool (especially the 28-day version) is that its responsiveness can identify bearish conditions on-chain even in a sideways market — note how September 2018 — November 2018 (Red #7) was a sideways market, but the 28-Day Strongest Hand Ratio was screaming overvaluation
- Two primary ingredients move the ratios into over/undervalued territory are (1) price and (2) ticket volume. If price moves up without heavy ticket buying to accompany it, the upside is limited until HODLers make their willingness to HODL known, and vice versa for dips in price
- Both ratios are currently in the undervaluation zone, signalling the network is trading below the implied value HODLers are allocating to it
- Note: This tool can only be used as of August 2017 due to the irregularity of ticket buying that was present with the original stake difficulty algo
In order to combine the strengths of both Strongest Hand Ratios, the author suggests turning the 142-Day Ratio into over / undervaluation price bands, while maintaining the 28-Day Ratio in its current form. These two combined will always give users a clear picture of the current state of affairs (as far as valuation is concerned) for the Decred network:

Additional Considerations
A few extra thoughts on the Strongest Hand Ratio and its relation to (1) BTCUSD and (2) DCRBTC price action (along with charts) include:
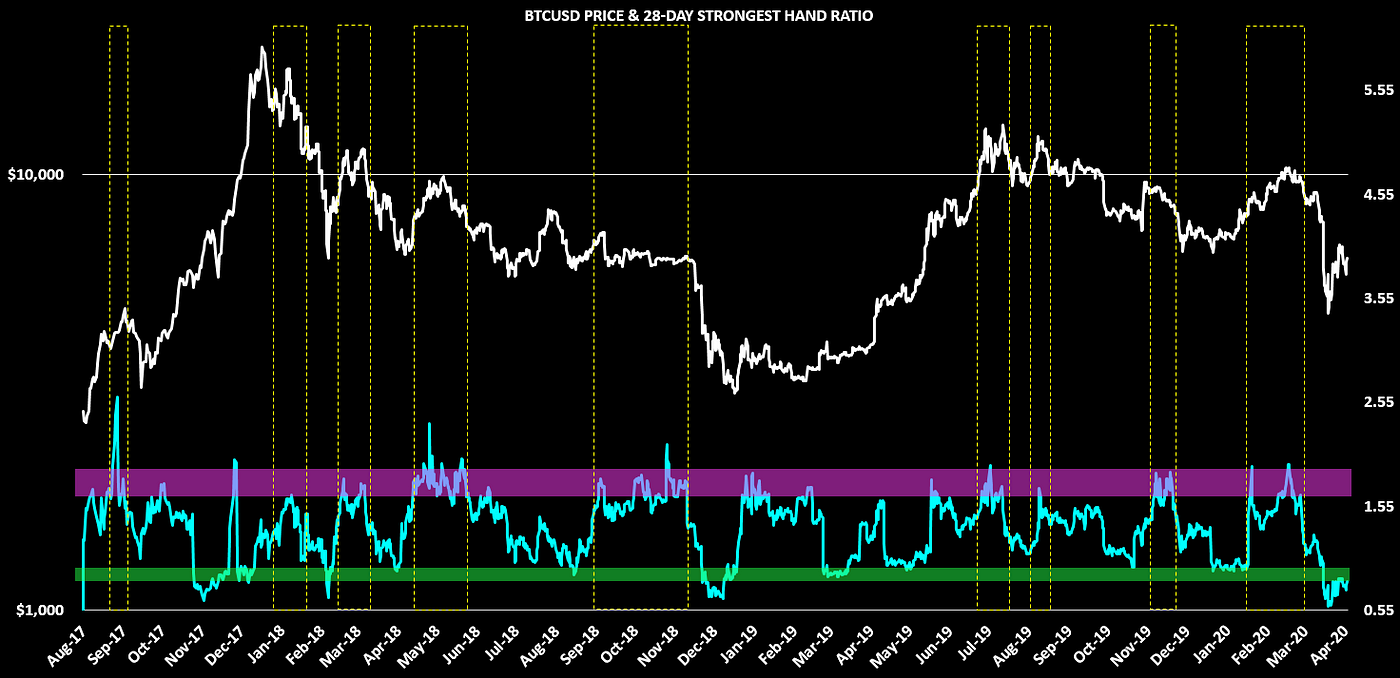
- The chart above shows BTCUSD vs the 28-Day Strongest Hand Ratio
- Boxed off are some examples of tops that the Strongest Hand Ratio identified for BTCUSD, showing that overvaluations in DCR (and thus ticket data) could indeed serve as a means to gauge appetite for crypto versus USD
- Note: August 2017 — Present has *largely* been a period of heavy and increasing correlation in DCR price action versus Bitcoin, so we will need to monitor how this holds up during periods where DCR correlation with BTC breaks down for an extended period of time


- DCRBTC and DCRUSD have generally been directionally tied — thus the Strongest Hand Ratio can help in identifying periods of DCRBTC over / undervaluation (although a little less accurate)
- Boxed off in the chart above are periods where Decred has been “undervalued”, and as can be seen — DCRBTC downside has been historically limited when the ratio sits in the green zone
Conclusion
Decred’s on-chain data continues to show a level of coherency that doesn’t cease to impress. From tickets, to standard transacting, to block rewards, and all three combined — the rabbit hole shows new depth upon each revisit. And back down the rabbit hole I go…
Big thanks to Oke Pearson for detail reviewing this piece.


Comments ()