

Decred On-Chain Mini Pub 2: HODL Power
Decred’s ticket pool is what makes its Realized Cap unique, and a psychological line in the sand for network stakeholders for short term price action.
By Permabull Nino - Jul 7, 2020 - An Adjusted Look at the Realized Cap
Relevant Reading
- Decred On-chain: Realised Cap, MVRV Ratio and Gradient Oscillators
- Decred On-Chain Mini Pub 1: Relative MVRV Ratio
Rationale
The two linked pieces above are components of the expanding documentation on Decred’s Realized Cap, one of the most powerful on-chain tools within the cryptocurrency space. Relevant information provided within these pieces are summarized below:
- Realized Cap: Network value calculated by price at which UTXOs were last spent (as opposed to current exchange-traded price)
- Realized Cap: On-chain cost basis of network participants
- MVRV Ratio = Market Cap / Realized Cap
- Decred’s Realized Cap is dynamic and moves closely with Market Cap
- Decred’s Realized Cap is a function of consistent UTXO flows from (1) ticket holders and (2) standard transactors
- Ticket Holders = HODLers
- Standard Transactors = Marginal buyers and sellers
Within this piece we will build on these principles in the following ways:
- The oscillations in % of DCR supply in the ticket pool can be viewed as a proxy for adoption over long timeframes
- Higher % = More Adoption
- Lower % = Less Adoption
- The higher the adoption, the more implied information about Decred is available, which = less potential upside in speculating on DCR
- The lower the adoption, the less implied information about Decred is available, which = more potential upside in speculating on DCR
- HODLers and standard transactors can be separated within the Realized Cap
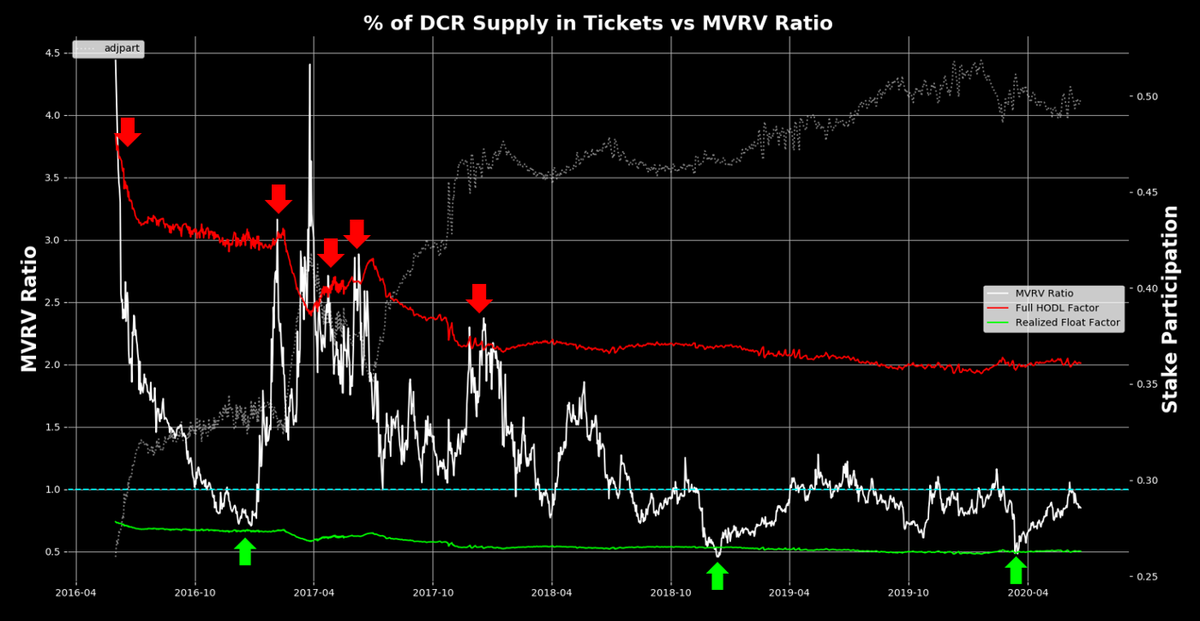
- We can use % of DCR supply in tickets to gauge where the MVRV Ratio should top and bottom
- Realized Cap = Current fair value based on current adoption levels
On-Chain Toolkit
Relevant tools for analysis with their respective calculations are included below:
% of Supply in Ticket Pool: Shows the current conversion rate (i.e. ability to turn standard transactors into HODLers) of outstanding DCR supply

Full HODL Factor: Adjustment multiple to calculate for full adoption (i.e. 100% of DCR supply in the ticket pool)

Full HODL Power: Illustrates the fair value of the network if Decred was at full adoption — with 100% of current supply within the ticket pool

Realized Float Factor: Adjustment multiple to calculate for supply held by non-adopters (i.e. DCR not in the ticket pool)

Realized Float Cap: Adjusts Realized Cap for the % of DCR supply that is NOT in tickets — showing the fair value of the network from the non-adopters point of view, and where they become heavily interested in accumulating DCR

Why Do These Tools Matter?
Decred’s ticket pool is what makes its Realized Cap unique, and a psychological line in the sand for network stakeholders for short term price action. However, the ticket pool, its size, how the size of it expands / contracts over the long term, and what this tells us about adoption / potential price action is an underexplored topic of discussion.
Locking DCR up in tickets come with opportunity costs, and those that do not lock DCR up in tickets signal to the network that they perceive these costs to be high. Over the short term, these costs are largely focused on price action. However, as adoption ramps up or winds down over the long term there’s an opportunity cost of holding what can be perceived as better or worse money (depending on what the user defines as “quality money”). The tools included within leverage the Realized Cap, the ticket pool’s impact on Realized Cap, and our understanding of these blockchain mechanics to help us better understand the valuation of the Decred network over both the short and long term.
Charts + Analysis
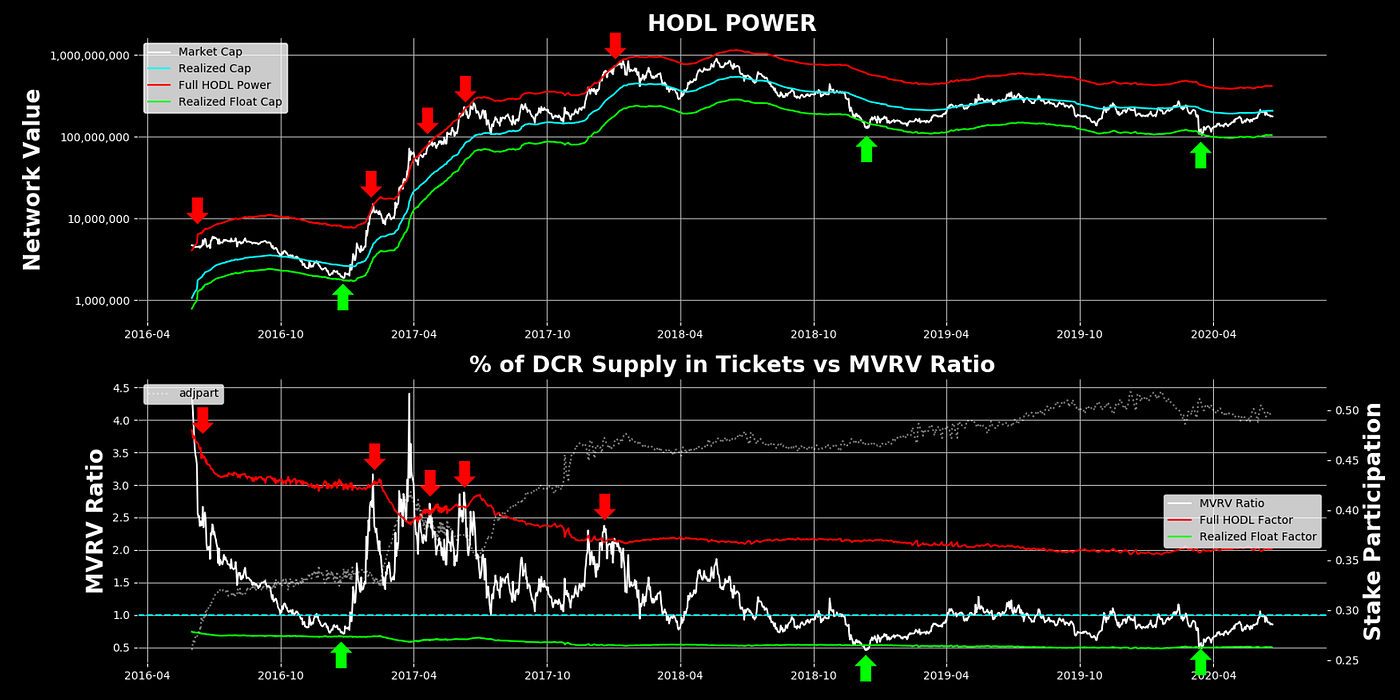

- During bull trends — support is the Realized Cap, with resistance at Full HODL Power
- During bear trends — resistance is the Realized Cap, with support at the Realized Float Cap
- MVRV Ratio consistently tops at the Full HODL Factor line
- MVRV Ratio consistently bottoms at the Realized Float Factor line — even catching the early 2017 shallow MVRV Ratio bottom
- As adoption ramps up, the gap between the Realized Cap and the Full HODL Power line narrows — showing a decreasing R/R as adoption accelerates
- As adoption ramps up, the gap between the Realized Cap and the Realized Float Cap line widens — also showing a decreasing R/R as adoption accelerates
- Over time, the Realized Cap and the Full HODL Power lines should converge if more and more DCR supply ends up in tickets
- When there’s lower amounts of DCR supply in the ticket pool, the Realized Cap behaves more like Bitcoin’s Realized Cap — rare visits below it, and Realized Cap provides little resistance on the attempted moves above it (see early 2017)
- When larger amounts of supply sit in tickets, the Realized Cap more accurately reflects current fair value, and as such transforms into a support / resistance line in bull / bear markets
- At full adoption (100% of DCR supply in tickets), DCR are constantly on the move, which is very deliberate HODLing. This should accurately reflect fair value of the network because the deliberate nature of DCR HODLing implies users understand the opportunity costs of keeping DCR versus moving funds elsewhere
- This change in behavior shows that Decred’s Realized Cap is incredibly adaptable and dynamic
Final Point
After this piece, we now have the following for Decred’s Realized Cap:
- Momentum indicator in the Realized Gradient
- A toolset for DCRBTC in the Relative MVRV Ratio
- An adjusted Realized Cap in the HODL Power toolset
Signing out.


Comments ()