


As we just established, legacy systems and public blockchains operate differently. These differences in system design provide us with varying quality of information when trying to determine the current state of affairs within these economies.
By Permabull Nino - Oct 21, 2019
A Network-Based Approach to Valuing Cryptocurrencies
Legacy Systems vs Public Blockchains
The concept of a public blockchain represents a paradigm shift in the way economies are designed, and how stakeholders within these respective economies analyze the current state of affairs. Legacy economic systems are designed to be (1) opaque and (2) subject to interference. Contrary to the opinion of some, this is a feature instead of a bug.
Opacity in any relationship, whether it be economic or interpersonal, requires substantially more trust, and demands safeguards to protect those who are on the outside looking in. Interference i.e. the ability to change course on a previously established game plan / agreement, is thus considered a valuable feature in legacy systems.
Through this lens, public blockchains such as Bitcoin and Decred do not necessarily represent replacements to the legacy systems, but rather complementary systems which provide (1) transparency and (2) resistance to interference. With this in mind, these new blockchains are filling a needed and unfilled niche in the global marketplace.
Roadmap
This paper will discuss the invention of public blockchains and how they:
- Provide higher information quality than legacy systems
- Welcomed in a new era of data driven, economic analysis
- Distill information to the public via User-Based and Network-Based indicators
- Can provide very high signal information through Network-Based indicators, in particular the issuance of new coins
Upon establishing these points, the focus will turn to Decred, covering:
- Decred’s coin issuance design
- Why Decred’s coin issuance design is unique
- The difference between % of total supply issued vs % of total block subsidy issued
- The needs and incentives of the Decred network, along with those of its 3 different stakeholder groups
- How to appropriately evaluate the Decred market cap performance over time using the Decred block subsidy
In the final section, we will apply our knowledge of how the Decred market cap performs vs the Decred block subsidy to evaluate:
- Litecoin’s market cap performance vs its block subsidy over time
- Bitcoin’s market cap performance vs its block subsidy over time
- Compare Decred’s performance to Bitcoin’s performance up to the same % of total subsidy issuance
System Design Differences = Differing Information Quality
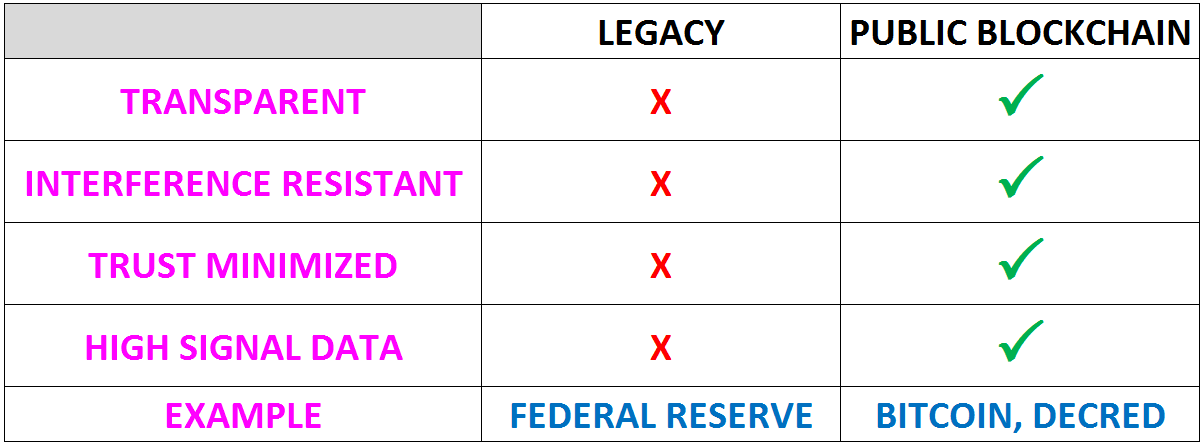
As we just established, legacy systems and public blockchains operate differently. These differences in system design provide us with varying quality of information when trying to determine the current state of affairs within these economies. The legacy system on one hand offers opacity and interference, which quite naturally leads to incredibly noisy data. This data is more difficult to retrieve, and constant interference within the system messes with data consistency / reliability. As a simple example: people are always wondering what the Federal Reserve is going to do next with rates (opacity), and the fact that the rates are subject to change at the Fed’s discretion kills any sort of consistency to plan around (interference). Thus, the parameters that legacy systems are built around result in noisier data.
Public blockchains, on the other hand, are designed to be high-signal datasets with the combinations of transparency and resistance to interference. Predictability and upfront establishment of parameters such as monetary policy make the system transparent, along with the obvious transparency provided by the public blockchain itself, which shows the movement of coins between network participants in real time. Furthermore, the distributed nature of systems such as Bitcoin and Decred allow for something incredibly important — resistance to interference in transacting. With predictable and public parameters for monetary policy, publicly available and real time transactional data from users, and a system that provides very little interference on the money-movement front, we can give a much higher degree of reliability to the data we find within these crypto-economies.
User-Based and Network-Based Indicators
The reliability of the public blockchain dataset has led to a new era of “on-chain analytics”, with analysts all over the globe checking in to the constantly flowing data. With this data, analysts build public or proprietary indicators for determining whether public blockchain-based monies are overvalued/undervalued, are being accumulated/distributed, and everything in between. Indicators can be generally broken down into two primary categories:
(1) User-Based: Takes user-oriented data to identify patterns / fractals
(2) Network-Based: Takes network-oriented data to identify patterns / fractals
Most on-chain data indicators fall into the User-Based category, as they are derived directly from the many ways the global userbase are interacting with blockchains, be it payments, speculation or storing wealth. On the other hand, ways in which the blockchain leaves a footprint of its own are substantially more limited. A quick list of data categories that eventually trickle into User-Based and Network-Based indicators are as follows:
(1) User-Based: Transactional data (coin age, transaction volume, realized value), Staking data (ticket buying volume in the case of Decred, as an example), and Mining data (hashrate)
(2) Network-Based: Issuance of new coins, Difficulty, Ticket Price (in the case of Decred)
The User-Based list dwarfs the Network-Based list. As the regulators of the incentive structure, Network-Based indicators do not need to be plentiful — just effective and consistent, as is the case with coin issuance:
Coin issuance within these networks is predictable and the issuance schedule will not change at any point up until maturity (at least in the case of Bitcoin and Decred). This is not user dependent, it is prescribed and defined as an emblematic characteristic from genesis.
New coins will be issued with a predetermined schedule for decay until the full supply (21 million coins) is rewarded to network contributors. It doesn’t matter if users are panic selling coins, miners are capitulating, the price is at an all time high, etc. — the coin issuance schedule remains the same.
These two datasets behave differently and thus on-chain analytics must account for User-Based metrics fluctuating as human needs change under varying circumstances, whereas Network-Based metrics hum along even under the most chaotic of environments. Network-Based metrics transcend humans with their epicly robotic consistency, which might provide us with even higher signal data than we see in the User-Based camp. Or at a minimum, with data that can be looked at through a different lens, which is where our discussion surrounding Decred begins…
Enter Decred
Decred is a cryptocurrency vying to become a digital store of value, similar to Bitcoin. However, Decred differs in a few ways:
- 4% of final DCR supply pre-mined and airdropped to community members
- 4% of final DCR supply pre-mined and purchased by the Decred development team
- Pre-mine / airdrop done with the goal of getting DCR in the hands of more people, and to safely jumpstart the staking aspect of the network
- 60% of block subsidy distributed to miners
- 30% of block subsidy distributed to stakers
- 10% of block subsidy distributed to treasury
The above combined with the definitions of “% of final supply issued” and “% of total block subsidy issued” are highly relevant to our discussion in the sections that follow. Below are the definitions of these terms, and how they particularly apply to Decred:

Now that we’ve broken down the highlights of Decred’s issuance of DCR along with the definitions (1) % of final supply issued and (2) % of total block subsidy issued, one huge takeaway that needs to noted from here it is this:
The Decred pre-mine makes it so that % of final supply issued is not the same thing as % of total block subsidy issued
This is important to understand, as in this paper we do not concern ourselves with blocks or % of final supply issued, but with % of total block subsidy issued. The block subsidy is what breathes life into these distributed verification networks, as otherwise there wouldn’t be any incentive to keep them alive (at least in the beginning). As such, people are all actually competing to accumulate as much of the block subsidy as possible. And this idea rings particularly strong with Decred, as it has 3 different ways for users to compete for these block rewards.
Decred Wants to Grow
We’ve talked about users and their need / want to compete for block subsidies, but the true meat of interest lies within the network itself and the block rewards it owns. These newly issued coins are the lifeline of the Decred network, as they are ammunition to get what the network wants most: to exist and grow. For the network to stay alive today and grow larger tomorrow, it needs to *incentivize stakeholders* to do the following:
- Enforce digital scarcity: Accomplished through the 60% PoW block subsidy and the 30% PoS block subsidy
- Upgrade as needed: Accomplished through the 30% PoS block subsidy
- Attract people to build on it: Accomplished through the 10% Treasury block subsidy
So, simply speaking — Decred is an entity with a goal to grow larger, at the cost of paying contributors who aid its survival via block rewards. The network’s execution in accomplishing this goal over time can be evaluated in its ability to outperform / underperform block subsidies in the following manners:
- Network Value vs Block Subsidies Previously Paid
- Network Value vs Block Subsidies Yet to be paid
- Network Value vs Projected Total Subsidy Paid at Maturity
After discussing the needs of network participants in the next section, the remainder of this paper will focus on analyzing the Decred market capitalization, see how it performs on a DCRUSD & DCRBTC basis, compare it to the three block subsidy tiers mentioned above, and lastly see how the Decred market cap performs against the PoW, PoS, and Treasury subsidies over time.
Needs of Different Network Participants
In the previous section we discussed how Decred (along with other public blockchains) have the goal to grow larger over time, and their means for baiting people into feeding their growth is through the block subsidy. What’s elegant about Decred’s block subsidy design is that it has diversified bait via its three-pronged approach (PoW, PoS, Treasury). Arguably, this should bring in talent from all across the board to help the network survive today and to grow larger tomorrow.
What’s also important to note is that these different groups of network participants have their own respective needs, and with these different needs come different time preferences:
- PoW: Miners are known as the largest compulsory sellers to cover up front and ongoing capital costs of any cryptocurrency, so the same assumption can be made for miners of Decred. This short time preference for holding should be considered when looking at block reward payouts over time.
- PoS: Stakers within Decred are known as the largest natural HODLer group, as they explicitly state to the network that they’re willing to hold DCR for up to ~140 days in order to secure validation and voting rights. This lock up results in costs associated with USD/BTC pricing volatility, so instead of bearing up front costs like miners, their price is paid less predictably.
- Treasury: The recipients of the network treasury are a mixed bag — some live off of their payments (which results in immediate sell pressure) and others work for the network / treasury in order to acquire more DCR. What is also unique about the treasury is that it is a non-human entity within the network, with no immediate needs, so funds can sit within the treasury for an indefinite period of time without moving
Readers need to understand these basics because in the following sections we’re going to not only look at network performance vs block rewards in whole, but also versus the specific rewards paid to these different network participant groups. By combining price action and reward payouts we are able to glean unique insights into block rewards, the network’s relationship to them, and network contributors’ relationship to them.
Network Value vs Block Subsidies Previously Paid
The ultimate and minimum goal for Decred is to become / remain more valuable than the sum of its block rewards paid out.
As an entity with this need, we can consider it fair to say that the network’s market cap vs its rewards paid to date can be considered its “Income Statement”.
If the network value is less than the sum of rewards paid to date, then we can say that digital entity itself is thus far operating at a loss. If the network value is greater than its total rewards issued to date, then it is operating in profit.
If looking at the sum of rewards paid to date shows the income statement of the network itself, we can say the specific rewards paid to PoW, PoS, and Treasury represent the income statement to these respective groups as well. By looking at these 4 in comparison to network value, we can see how they’re faring / have fared to date. Below we have the following plotted:
(1) The Decred Market Cap (denominated in both USD and BTC)
(2) Total Sum of Block Rewards Paid to Date (SUM)
(3) Rewards Paid to PoW to Date
(4) Rewards Paid to PoS to Date
(5) Rewards Paid to Treasury to Date
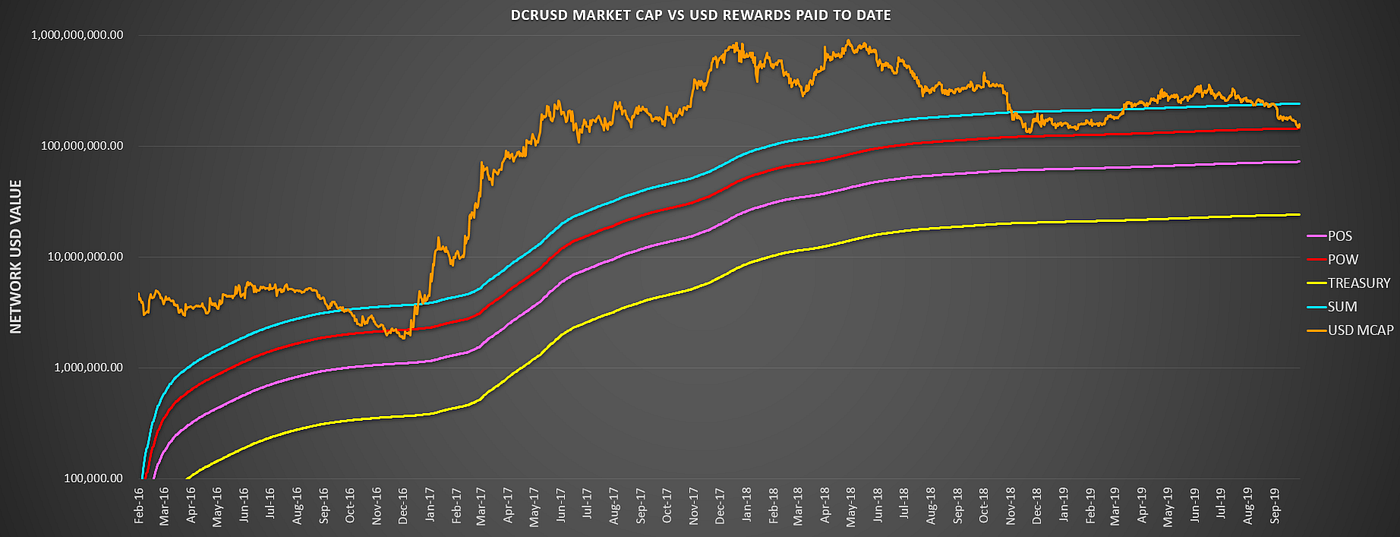
This chart tells an interesting story — as you can see, the network has spent the majority of its lifetime above the total SUM line, which tells us that the network has been operating in profit as an entity. Furthermore — when the network breaks below the SUM line it has been a historically good time to accumulate DCR.
However, the most telling part of this chart is the fact that the DCRUSD market cap has bottomed on multiple occasions at the POW line. If anything this tells us something that many have speculated within the Bitcoin space — miners and their bottom lines can put the bottom in. As the natural largest sellers of DCR and 60% of the block subsidy, they’re very capable of doing this. It’s important to note that miners’ costs are denominated in fiat so this chart naturally is more likely to tell us more about mining behavior than the DCRBTC chart.
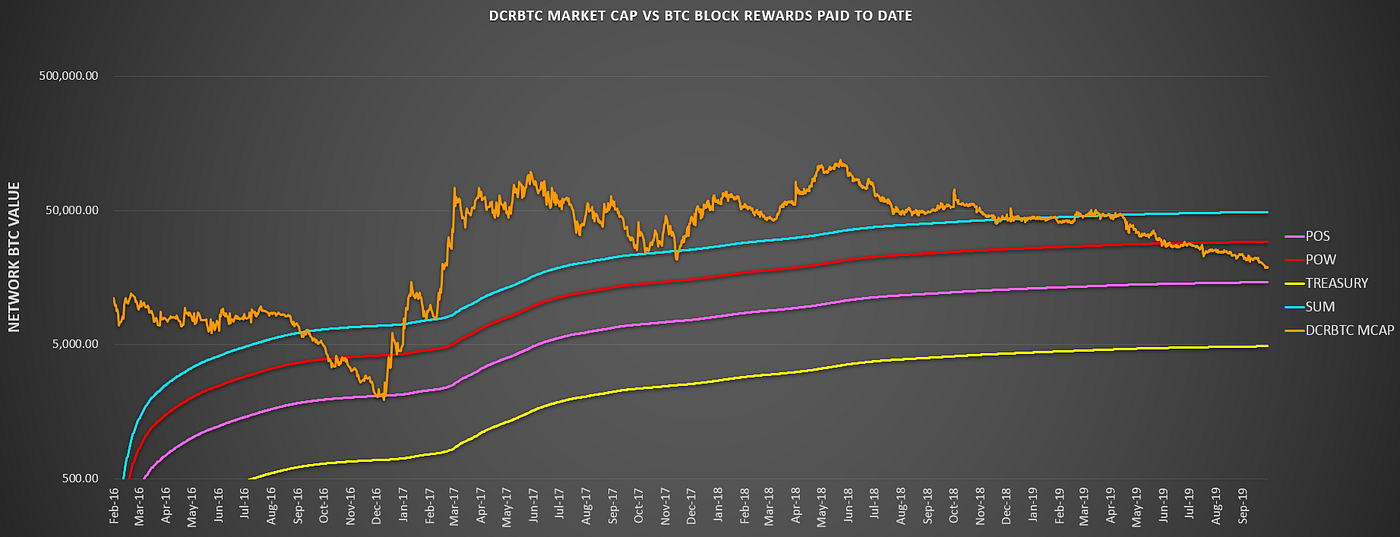
By dividing the Decred market cap by the BTCUSD price, you can chart the Decred market cap value in the amount of BTC the network is worth. This same logic can be applied to the block subsidies paid to the 4 groups of network stakeholders as well.
The DCRBTC chart tells an equally interesting, yet very different story. Now, the dynamics at play are a little more complex than the DCRUSD chart, so it might be helpful to break things down using bullet points:
- SUM: Ability for the young Decred network to bootstrap value faster than a more established Bitcoin.
- SUM ANALYSIS: In the DCRUSD chart the price hovered comfortably above the SUM line for the majority of its lifetime, but that is not the case with DCRBTC. This isn’t surprising, as outperforming BTC is substantially more difficult than outperforming USD, as BTC is on an exponential growth curve of its own. What’s even more thought-provoking is the amount of times the DCRBTC market cap tested the SUM line, treating it as support on multiple occasions during its lifetime. Also, after seeing how often its been tested, it’s not surprising the DCRBTC market cap has fallen quite rapidly since breaking through it — currently trading at 40% of the total BTC rewards paid to date. If the network also has a goal to gain value vs BTC, it’s currently operating at a heavy loss.
- POW: Miners operating on BTC terms, this line might represent a switching point for miners looking to hedge profits.
- POS: Line where it makes most sense for HODLers to hedge BTC profits into DCR
- POS ANALYSIS: A worthwhile observation to pay attention to as Decred attempts to find its bottom is that the DCRBTC market cap bottomed in early 2017 at exactly the POS line. Miners are known to put the USD bottom in, does this mean that DCR HODLers are the ones who put in the DCRBTC bottom? Intuitively, it makes plenty of sense, but this thesis might need more time to prove itself.
- Treasury: Purchasing power of treasury over time vs BTC
- All 4 lines also represent the break even to date of their rewards earned vs BTC. Assuming any of these stakeholder groups don’t sell their rewards after receiving them, you can assume they’re in profit vs BTC while DCRBTC market cap sits above their respective line, and in loss while DCRBTC market cap sits below their line.
Network Value vs Subsidies Yet to be Paid
Hard cap, decaying issuance monies like Decred are unique in that users know upfront how much of the remaining subsidy is yet to be paid out, and also have a high level of assurance that the subsidy will actually be issued to network contributors. This information being known up front by users make this issuance of new DCR not a shock to the system, but rather a built in expectation and something that users should aim to acquire as much of as possible.
As such, there’s an argument to be made that remaining block rewards are not “inflation”, but actually can be considered “cash on hand” for the network itself, miners, stakers, and the treasury. In other words, subsidies yet to be paid represent the Net Assets / Equity on these stakeholders’ Balance Sheets, and as such should represent the minimum value the network should trade at any point in time.
If the market cap ever drops below the “Cash Cap” i.e. the SUM of all future rewards to be paid, then the network is trading below its cash value.
By taking historical DCRUSD and DCRBTC reward data, normalizing for full subsidy issuance, and pro-rating to remaining % of rewards to be issued, we can build the cash values to DCR for the 4 stakeholder groups (including SUM, which represents the network itself). This calculation goes as follows:
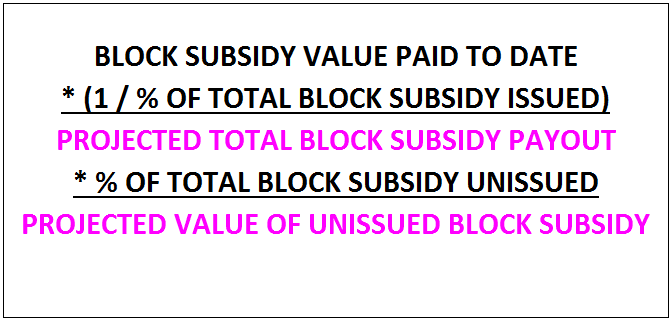
Here are the DCRUSD and DCRBTC “Cash Cap” charts:

The first thing that stands out in this chart is how outrageously mispriced Decred was for all of 2016, trading at below even its Treasury cash value. Without question, this was an amazing opportunity — one that will likely not come around again for Decred fans. Also, recall how everyone called the 2017 run up for altcoins a bubble? This chart shows that this is not the case for Decred — it was merely a correction of an egregious mispricing in the cash value of DCR. In the chart we also see that the SUM line was the bull / bear line for DCRUSD, serving as support during the bull and now is proving to be formidable resistance during the bear market. However, the point remains — buying DCR while DCRUSD sits below its network “Cash Cap” i.e SUM line is a great buying opportunity.
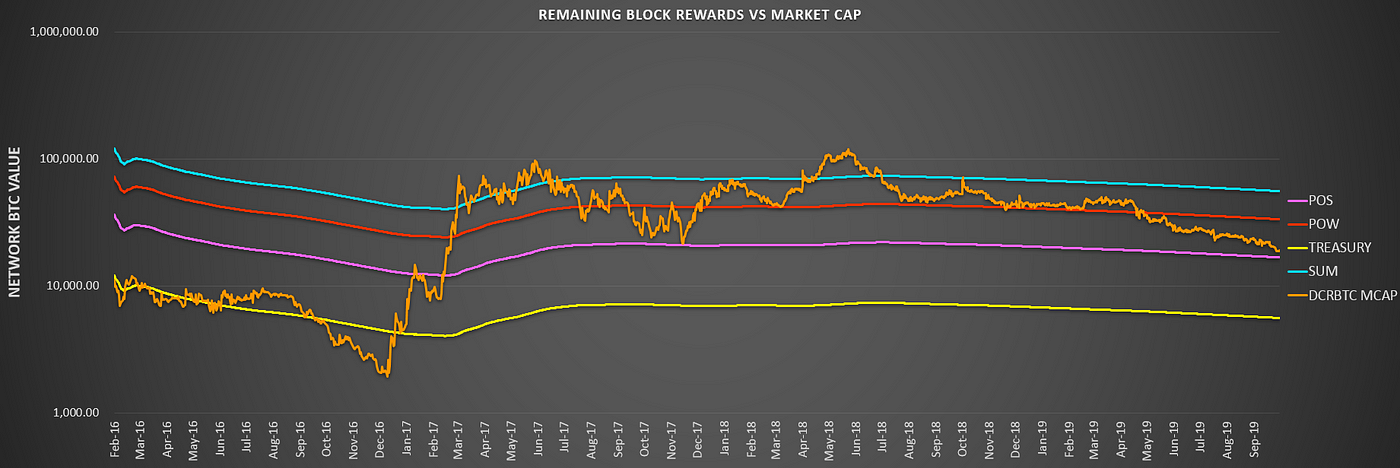
The DCRBTC chart shows something very similar to DCRUSD — the network value was trading below its Treasury cash value pretty much up until 2017. Also, notice how the “Cash Cap” was a magnet for the network value during the 2017 “bubble”, and predicted what ended up being a 25x increase in Decred network value on a DCRBTC basis. It is worth noting is that the network value seemed to bounce around / respect the cash values of the network (SUM), POW, and POS. Today the DCRBTC market cap is trading at <40% of it SUM cash value. I expect the SUM line to continue to act as a magnet for network value following bearish periods of undervaluation. It is therefore likely Decred will be repriced in a similar manner to the opportunity observed in 2016 in due course.
Additional note: DCRBTC market cap is currently trading within ~10% of the POS cash value line.
Network Value vs Projected Total Subsidy Paid at Maturity
So far we’ve covered and built the Decred Income State (Previously Paid Rewards) and the Decred Balance Sheet (Unpaid Rewards), now we can build a forward looking statement to see where we expect the different stakeholder groups to break even on their respective block rewards. This will be important and making projections for where we can *at a minimum* expect the network value to land over the long haul on a DCRUSD and DCRBTC basis:
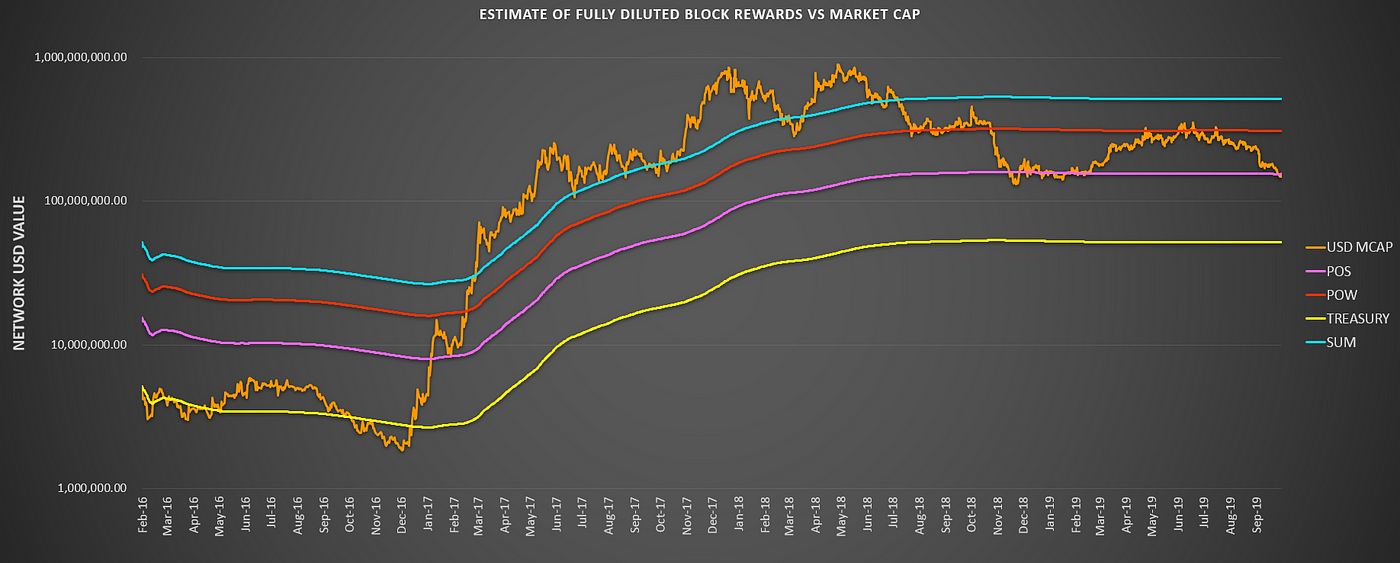
In terms of trend lines, this chart has the tightest fit to market cap, as almost every historically significant bounce has occurred at one of the 4 lines. As of today the network and miners are underwater on their full maturity break even prices, with the full maturity profitability of POS currently being challenged for the second time in 2019. While price sits below its SUM line, the network sits below its full maturity break even — which should make you ponder: do you think Decred will be worth more or less than $500MM (where the current SUM line sits) when the block rewards run out in 2140? If you do not think that is the case, you would load your DCR bags at any place below it.
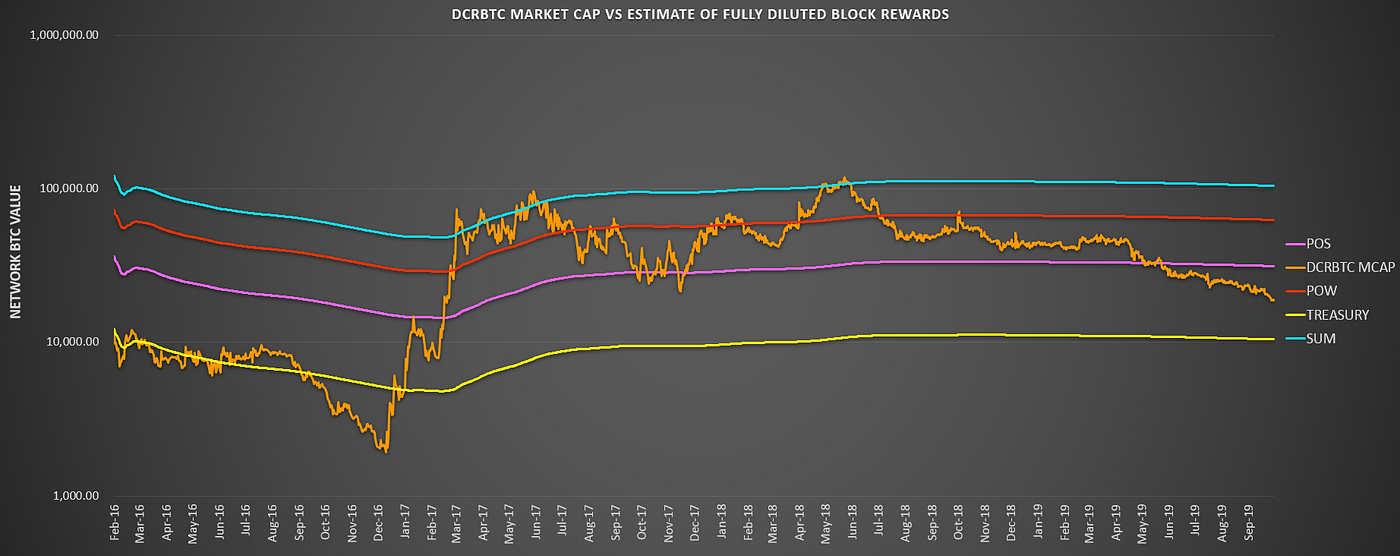
Just as in the previous section, the DCRBTC SUM line was a magnet for what was a massive Decred mispricing. However, we would be remiss to not mention that the SUM line sniped the two tops of the DCRBTC bull market with an incredible precision — within 20% of the early 2017 top and 10% of the mid 2018 top. These tops being nailed makes me wonder if this either (1) the top of the DCRBTC channel to watch over its lifetime or (2) will serve as a mean value for the Decred network over its lifetime. If the Decred network value breaks above this line convincingly in its next run up, I will start to lean more towards #2. If you believe block rewards are a fair way to fundamentally value a crypto network (which I believe the case has been made herein), then the SUM line *in theory* should be a magnet for the long term minimum DCRBTC market cap.
Litecoin and Bitcoin Performance vs Block Reward
Now let’s quickly run through Litecoin and Bitcoin Market Caps, and see how they perform vs (1) block rewards paid to date and (2) projected total block reward payout at maturity. By doing this, we can see get a better idea for Decred and its performance relative to its other hard-cap supply comrades. Below are the Litecoin charts:
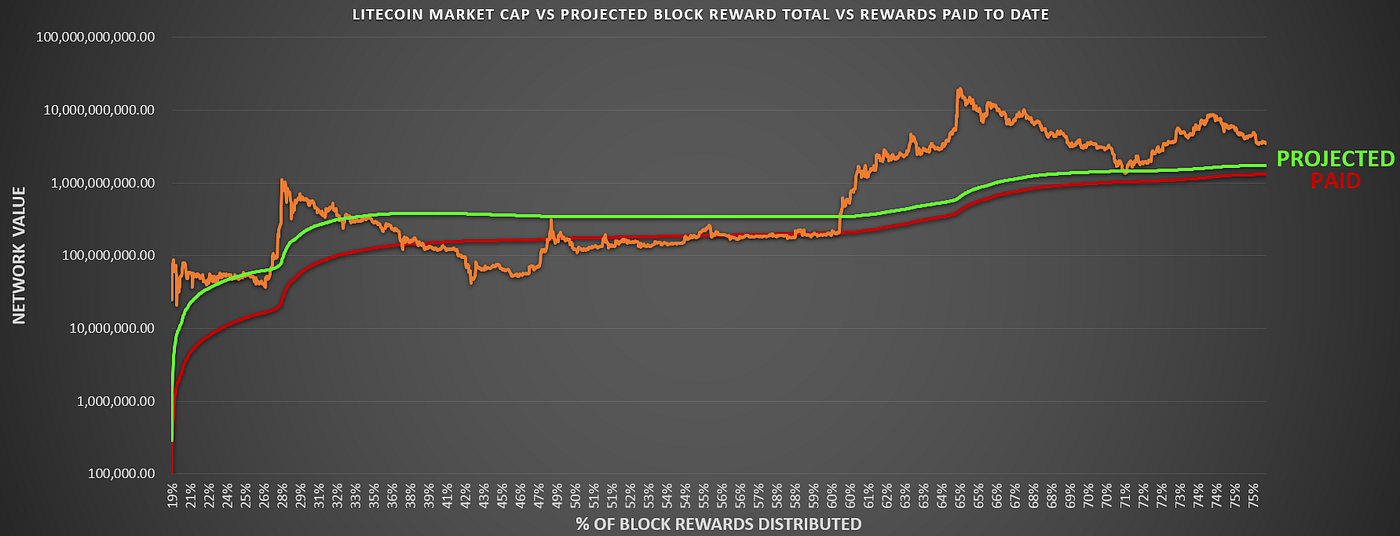
To date Litecoin has traded very closely to both its Projected and Paid block rewards over its lifetime. At least in the case of Litecoin, block rewards seem to be a good way to track network value on a long term basis. My expectation would be that at some point the network value would need to distance itself from the block rewards as a means for valuing the network, so I’m not sure this is a good thing. Over time, these networks need to depend on fees to survive, so trading closely to cumulative sum of rewards at almost 80% of subsidy issuance (i.e.bootstrapping ammunition 80% gone) brings some concerns to the table, but that is an issue for another day. It’s hard to gauge distance between the Litecoin Market Cap and Projected Rewards using this chart, so here’s a ratio version of the two:
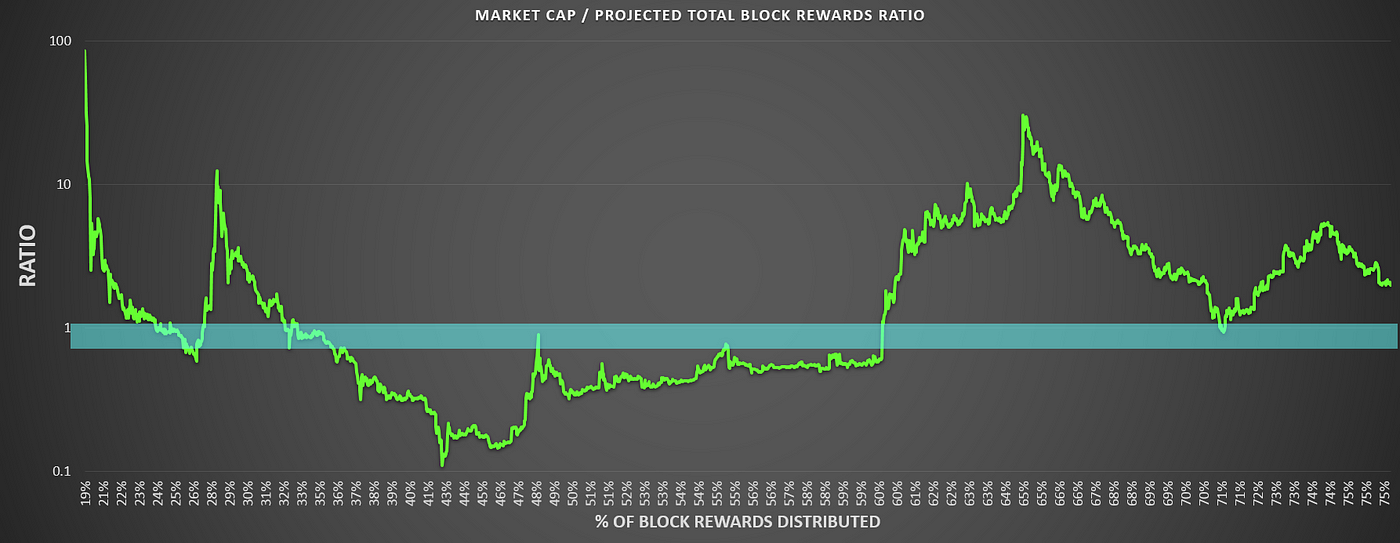
As of this writing, Litecoin Market Cap is trading ~2x of its Projected Total Subsidy, at ~76% of total subsidy issuance. Here are the Bitcoin versions of these charts:
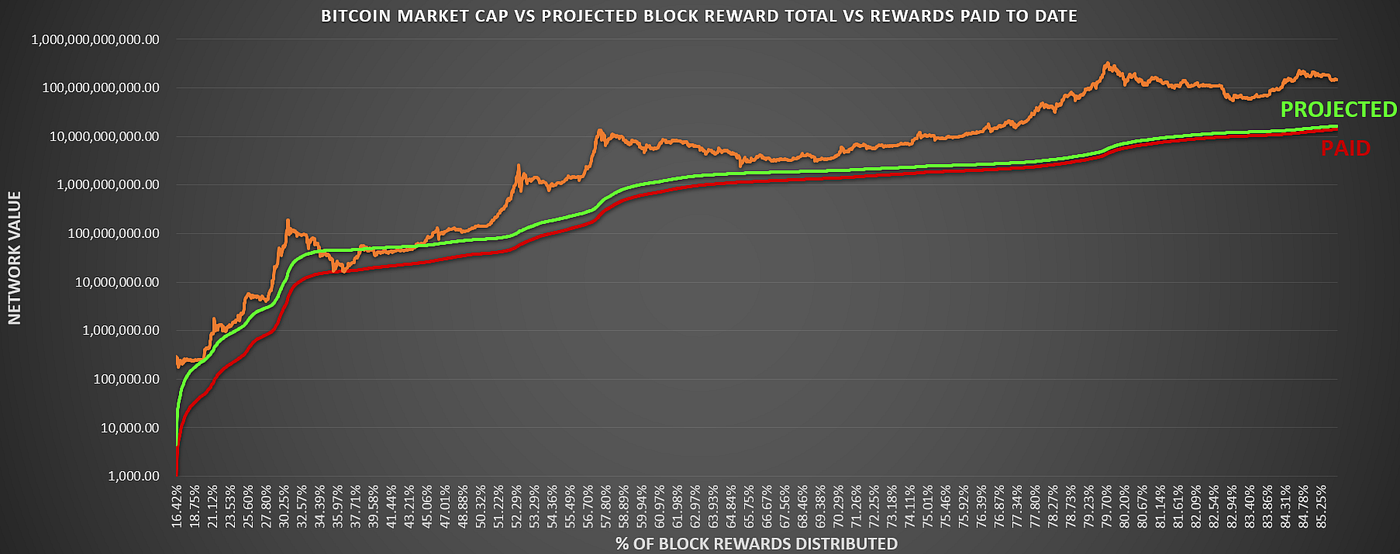
The Bitcoin chart looks substantially more bullish than the Litecoin charts at first glance — Bitcoin broke above its Total Projected Subsidy at around 45% projected full subsidy issuance and hasn’t revisited it since. However, it did get close at the end of the 2013 / 2014 bear market, by closing at its lowest point only 38% higher than the Total Projected Subsidy line, as can be seen with the red circle in the chart below (please note that this low point was around 65% of Total Projected Subsidy, and price didn’t distance itself from the line significantly until approximately 70% full subsidy issuance):
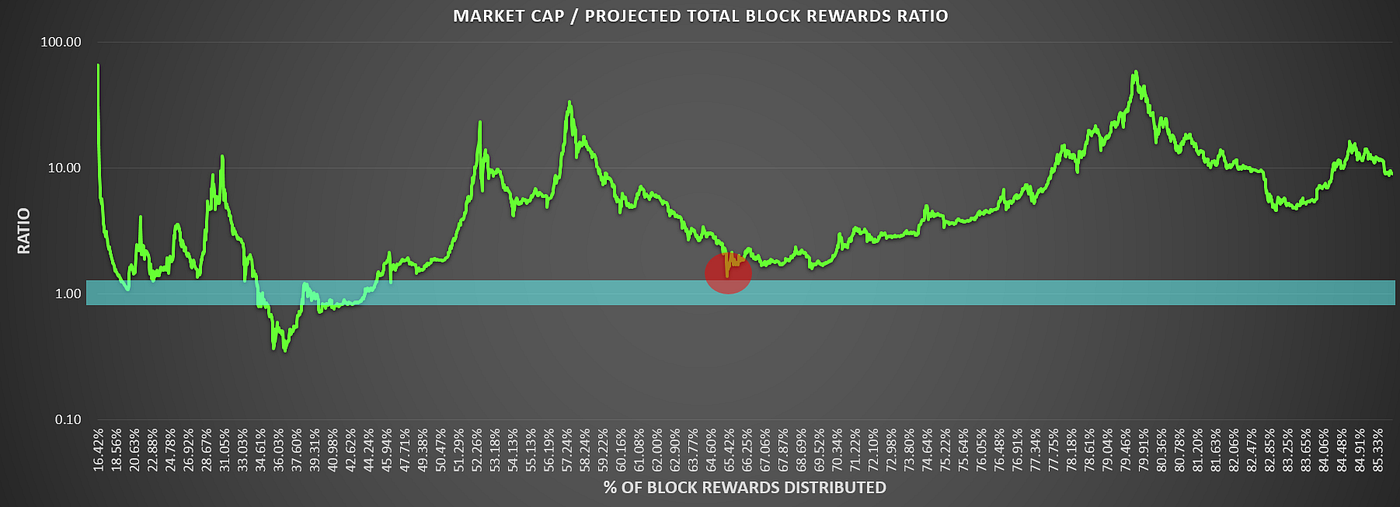
As of this writing Bitcoin is trading at ~9x of its Total Projected Subsidy with ~86% of its full subsidy issued.
Decred & Bitcoin Comparison in One Chart
A key question after looking through all of this data was “is this price action reasonable almost 4 years into Decred’s existence?”. So in order to scratch everyone’s own itch, I put together a single chart which should tell us the answer. Below the following lines are plotted:
- Decred USD Market Cap
- Decred USD Block Subsidy Paid to Date
- Bitcoin USD Market Cap
- Bitcoin USD Block Subsidy Paid to Date
- All 4 lines are plotted using % of Total Block Subsidy Issued as the X-Axis, that way we can get a fair comparison of Decred and Bitcoin up to this point in their respective block subsidy issuance lives
- Decred Market Cap / Block Rewards Paid to Date Ratio
- Bitcoin Market Cap / Block Rewards Paid to Date Ratio
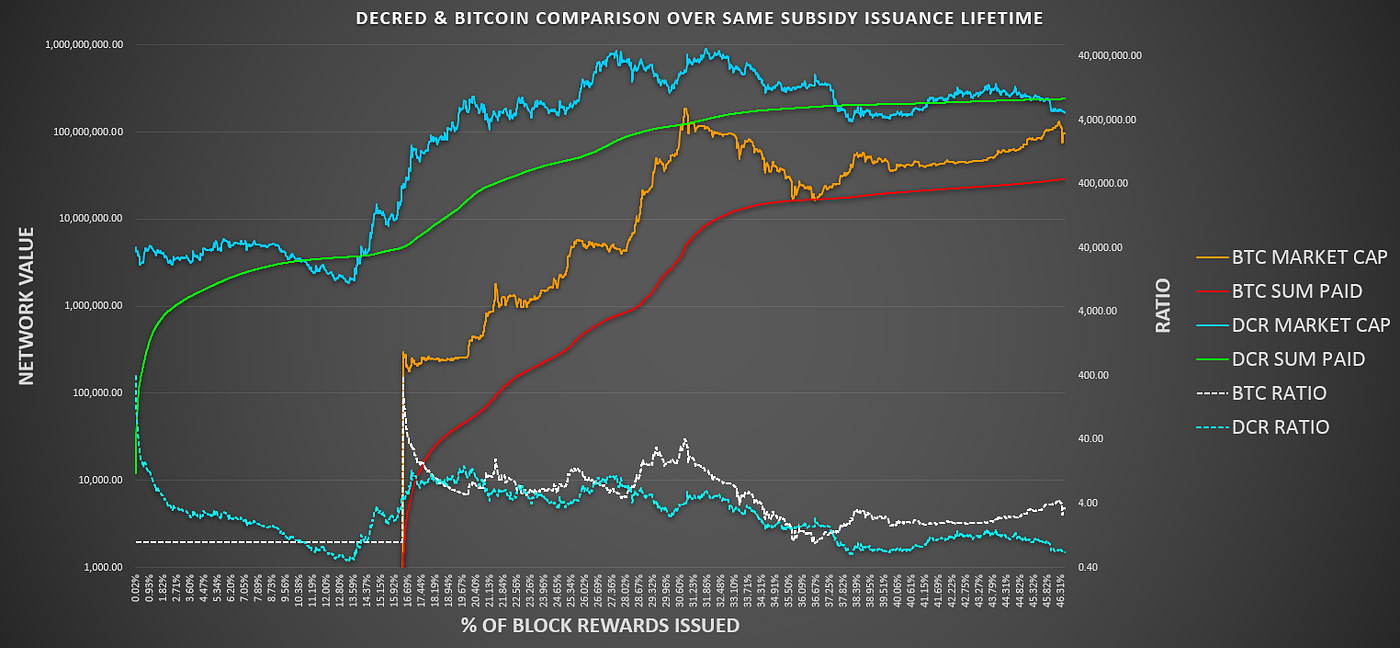
The resemblance is something to behold. Bitcoin has outperformed on a ratio basis — however — the Decred ratio has moved incredibly close to Bitcoin’s over the same lifetime period. Decred’s market cap and sum of rewards is larger than Bitcoin’s was to date — but the proximity of these values are also closely tied.
Putting It All Together
In order to understand price action surrounding Decred you need to understand both the User-Based and Network-Based indicators. However — it is my opinion that Network-Based indicators better help truly, fundamentally value Decred (at least early in its life), and the ripples that occur between valuation plateaus are marked and driven by the User-Based indicators. In future pieces my focus will turn to the highest signal User-Based indicator for Decred, Proof of Stake ticket data, to show how the largest subset of DCR holders impacts price over shorter timeframes. By locking down the foundation via understanding Network-Based data, we can move forward with much more ease to understand where ticket data fits into the big picture. However, before concluding we’ll go through a bullet point summary of what we’ve covered within:
- Public blockchains are transparent and resistant to interference, which make them high signal resources for economic data.
- On-chain indicator categories include User-Based and Network-Based indicators
- Most indicators fall into the User-Based category, but Network-Based ones are unique in their scarcity and robotic consistency
- Decred has a unique block subsidy design, with three different groups of stakeholders paid out on a block-by-block basis, all with different goals and incentives
- There are 3 primary considerations when it comes to the block subsidy of Decred — (1) Rewards Previously Paid, (2) Rewards to be Paid, and (3) Total Projected Reward Payout
- Rewards Previously Paid = Network Income Statement (i.e. is network in profit on its goal to become more valuable on a USD & BTC basis?)
- To date miners have put the USD bottom in for Decred, by bouncing the price on every visit of the POW line on the Network Income Statement chart
- Rewards to be Paid = Network Balance Sheet (i.e. is the network valued above or below its Net Assets / Equity?)
- The Decred network is currently trading below its Net Asset / Equity value (also known as “Cash Cap”)
- The Network Balance Sheet chart showed that the 2017 run-up for Decred wasn’t a bubble, but rather a correction of an asset mispricing back to its cash value
- Future block rewards are bootstrapping ammunition, and should be viewed as an asset the network owns as opposed to inflation
- Total Projected Reward Payout = Network Forward Looking Statements or Future Projected Breakeven Market Cap
- Block rewards are useful for tracking network value for hard capped cryptocurrencies early in their lives (at a minimum), as Bitcoin and Litecoin both tracked closely to their Total Projected Subsidies for >50% of their subsidy lives
Signing out,
MASSIVE thank you to Checkmate, Richard Red, and JZ, who kindly took the time to detail review this piece.
Also thank you to Anil Lulla and Delphi Digital, whose extensive research piece on Decred helped give me the initial spark for looking deeper into block rewards.


Comments ()