

DCRDATA Proof of Work Charts
Charts let you build impressions of performance, for now, the past and for the longevity of a project. let’s start by looking at the Proof of work charts found on DCRDATA and the stories they might be telling and what you might look out for as the data progresses.
Hopefully, by now you’re getting a good understanding of how powerful a block explorer is and how DCRDATA is leading the way in pretty much every area compared to other block explorers.
As previously discovered, each block contains a massive amount of information. This information has been permanently stamped on the blockchain and can be accessed at any time. Individual blocks on their own will build a small picture of what’s happening on-chain, but when you put all the blocks together, the picture tells a much bigger and interesting story.
Charts let you build impressions of performance, for now, the past and for the longevity of a project. let’s start by looking at the Proof of work charts found on DCRDATA and the stories they might be telling and what you might look out for as the data progresses.
Proof of work charts include – the Hash Rate, POW Difficulty, Duration Between Blocks and Total Work. And let’s not forget to run our calculation through the Attack Cost Calculator, to see how expensive the chain is to attack.
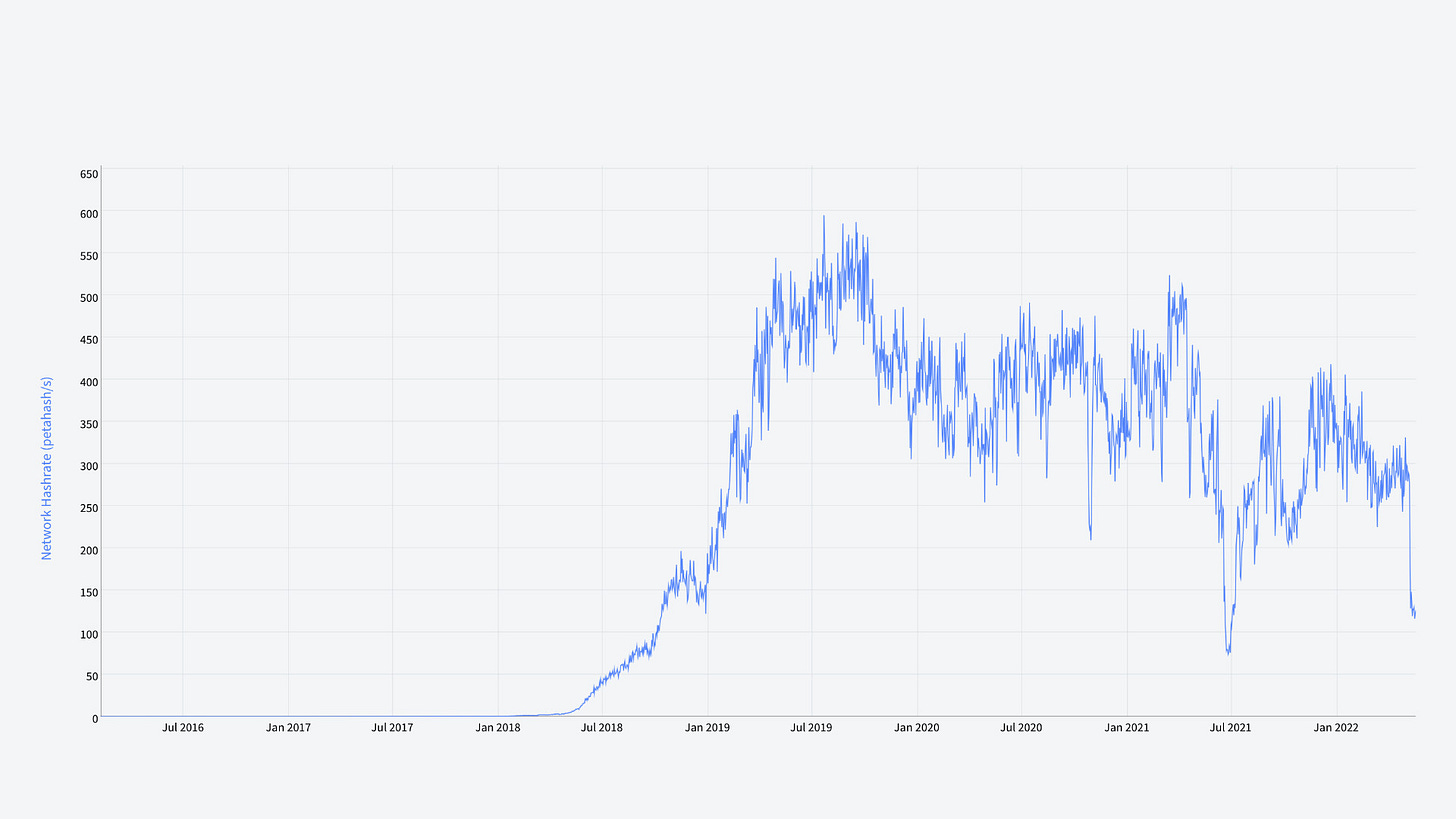
First the POW Difficulty and the Hash rate. These two charts should be in lock step with each other. In pure proof of work systems, the higher they are, the more costly the attack. Decred only needs a fraction of the PoW to be equally secure as a project with the same project value (approximately 10X less hash rate), due to its hybrid PoW / PoS protocol.
Another interesting factor, on the Decred blockchain the difficulty gets adjusted every 12 hours or 144 blocks. In comparison to Bitcoin where the adjustment happens roughly every 14 Days or 2,016 Blocks. The aim here is to make sure blocks are being produced at a consistent rate, in Decred’s case as close to 5 minutes as possible.
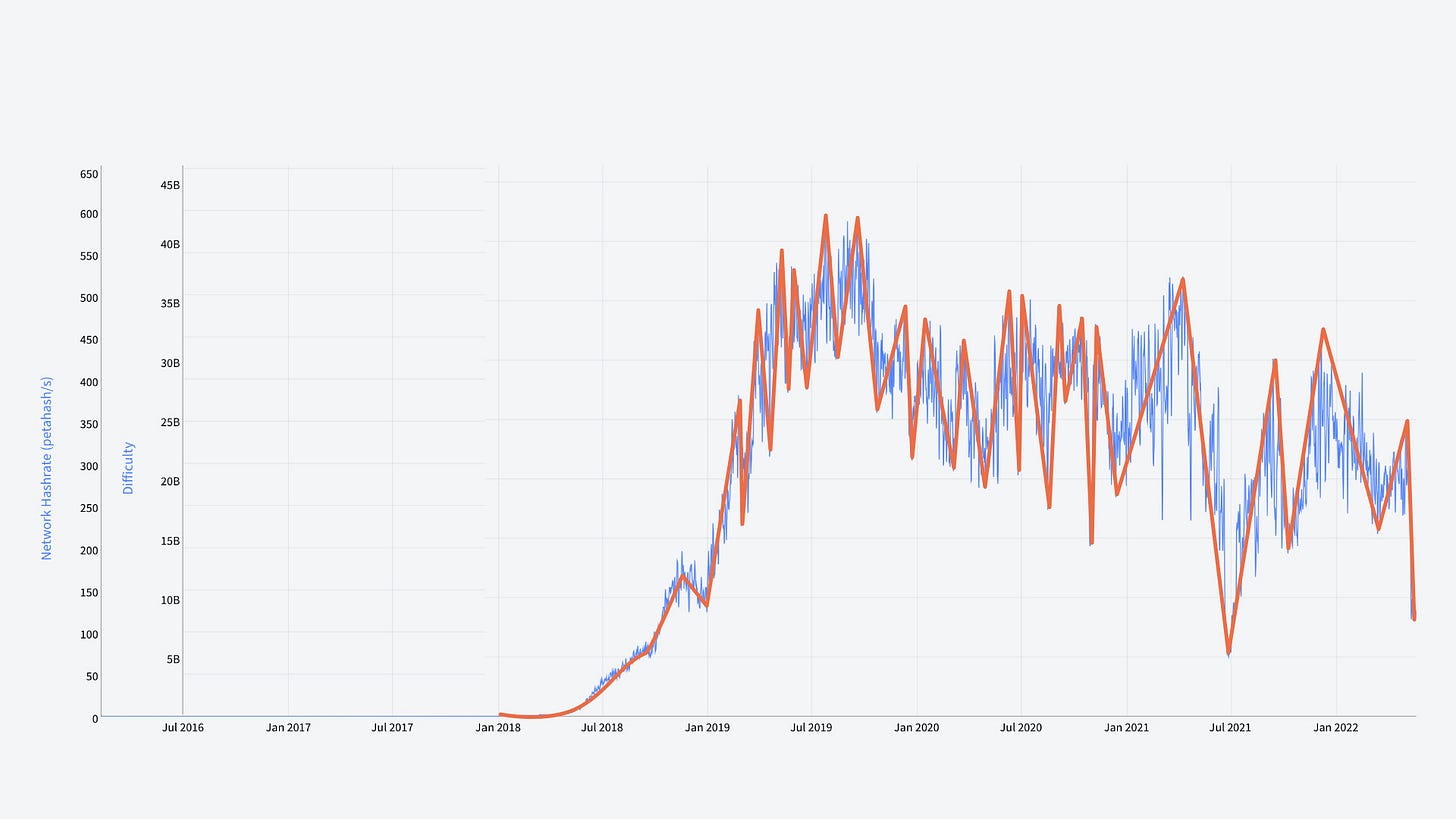
Points of interest on these charts include hash rate dumps and how well the PoW difficulty adjustment kept up with them. We can also overlay the block time to see if the block production around these times was out of sync and by how much. The block production aims to be as close to 300 seconds as possible, or correct to that point as quickly as possible. Chart areas that stand out include:
March through to September 2018 – when the ASIC miners started to come into circulation. The hash rate went from 1.3 Ph/s to 85 Ph/s which formed a good baseline for future security. In future months the hash rate continued to go up but at a hash rate of 85 Ph/s Decred had a cost to attack of approximately $150 million per hour. At the end of September 2018, Decred had a fully diluted market cap of $655 million, only four times higher than the cost to attack.
October 2022 – There was a higher than usual miner outage which caused the hash rate to drop from highs of 475 Ph/s to 209 Ph/s, which quickly rebounded, but started a declining trend line down to averages of 300 Ph/s.
June 2021 – China started banning large mining operations. These operations then moved to other locations across the world. At this time, hash rate hit a new post ASIC low of 80 Ph/s down from highs of 511 PH/s. One thing this demonstrated, is how centralised mining has become. It can also be reasonably assumed, that over 75% of all Decred’s miners were located in China. It’s also important to note that the majority of PoW projects suffered this same event to a similar degree.
May 2022 – Hash rate reduces to 90 Ph/s down from an average of 275 Ph/s after Decred reduced the miner block reward from 60% to 10% per block, to combat mining centralisation and miner price suppression. Two interesting points here include the cost to attack is still over $339 million per hour, with a fully diluted market cap of $622 million. The second point is, the project is now over 67% more environmentally friendly than before the consensus change. And from the height of 511 Ph/s Decred’s environmental impact has reduced by almost 82%.
From these two charts, some of the things I look for are:
- Is the hash rate above my preferred 80+ Ph/s
- Is the difficulty being adjusted in lock step with the hash rate
- Are the blocks being produced as close to the 5-minute mark as possible.
If these factors alone remain constant the cost of attack remains very high, on the prerequisite the proof of stake element remains decentralised and has a good level of participation. Which we’ll look at in the next article. It’s also important to note the 80+ PH/s is my baseline, even below this the cost of attack in comparison to a pure PoW chain is still very high.
If the hash rate drops to new lows, it might also be worth understanding miner profitability cycles. Typically, miners are big sellers, and they tend to sell at opportune times, e.g. when price has increased within their billing cycle. On the Decred chain, before the subsidy split, miner profitably was incredibly high. After this consensus change, miner profitability reduced below break even. They are naturally in the process of reducing their cost exposure, which is likely to continue for some months.
For a miner to currently break even or become profitable on the Decred chain, one of the following three scenarios needs to be met (this research is based on the current average electric cost; price to purchase hardware and the DCR reward):
- Hash rate needs to reduce to at least 120 Ph/s if DCR price is approx $40 (Break even)
- DCR price has to increase to $80+ if hash rate stays at approx 275 Ph/s (Break even)
- Hash rate has to drop to at least 120 Ph/s and the price has to increase to $80+ to become profitable long term
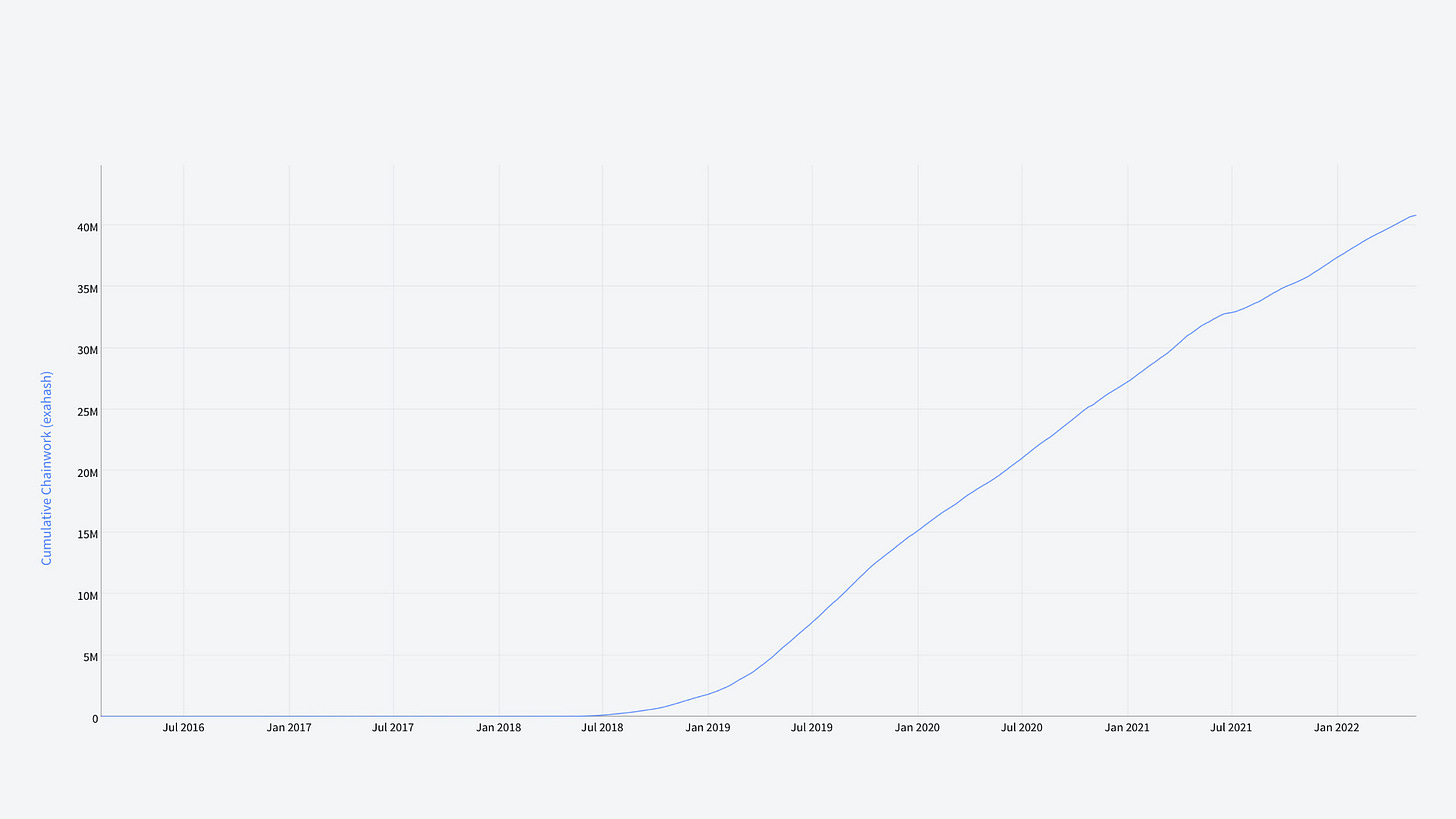
The final chart to look at in this section is the total work for the chain. Very simply, a steady increase is a good example of a chain performing as expected. You’ll notice, once the ASIC miners got turned on this chart’s projection became very steep, but since the miner reward reduction it’s likely this trajectory will reduce to a more sustainable level.
In the next DCRDATA video, we’ll look at the Proof of stake charts and how they deliver security and governance to the system.
Thanks for reading and if you liked this article and want to show your support, don’t forget to give it a like, comment and most importantly subscribe to the channel.


Comments ()