

DCRDATA Proof of Stake Charts
Decred’s proof of stake is the counter security mechanism to mitigate against potential miner bad behaviour. It’s also used as the governance mechanism for consensus changes and treasury spending. In this article, we’ll focus on the POS charts and what the information is telling us
Decred’s proof of stake is the counter security mechanism to mitigate against potential miner bad behaviour. It’s also used as the governance mechanism for consensus changes and treasury spending.
In this article, we’ll focus on the POS charts and what the information is telling us about the prosperity of the chain. The charts we’ll focus on include:
- Ticket price
- Ticket Pool size
- Ticket Pool value
- and Stake Participation
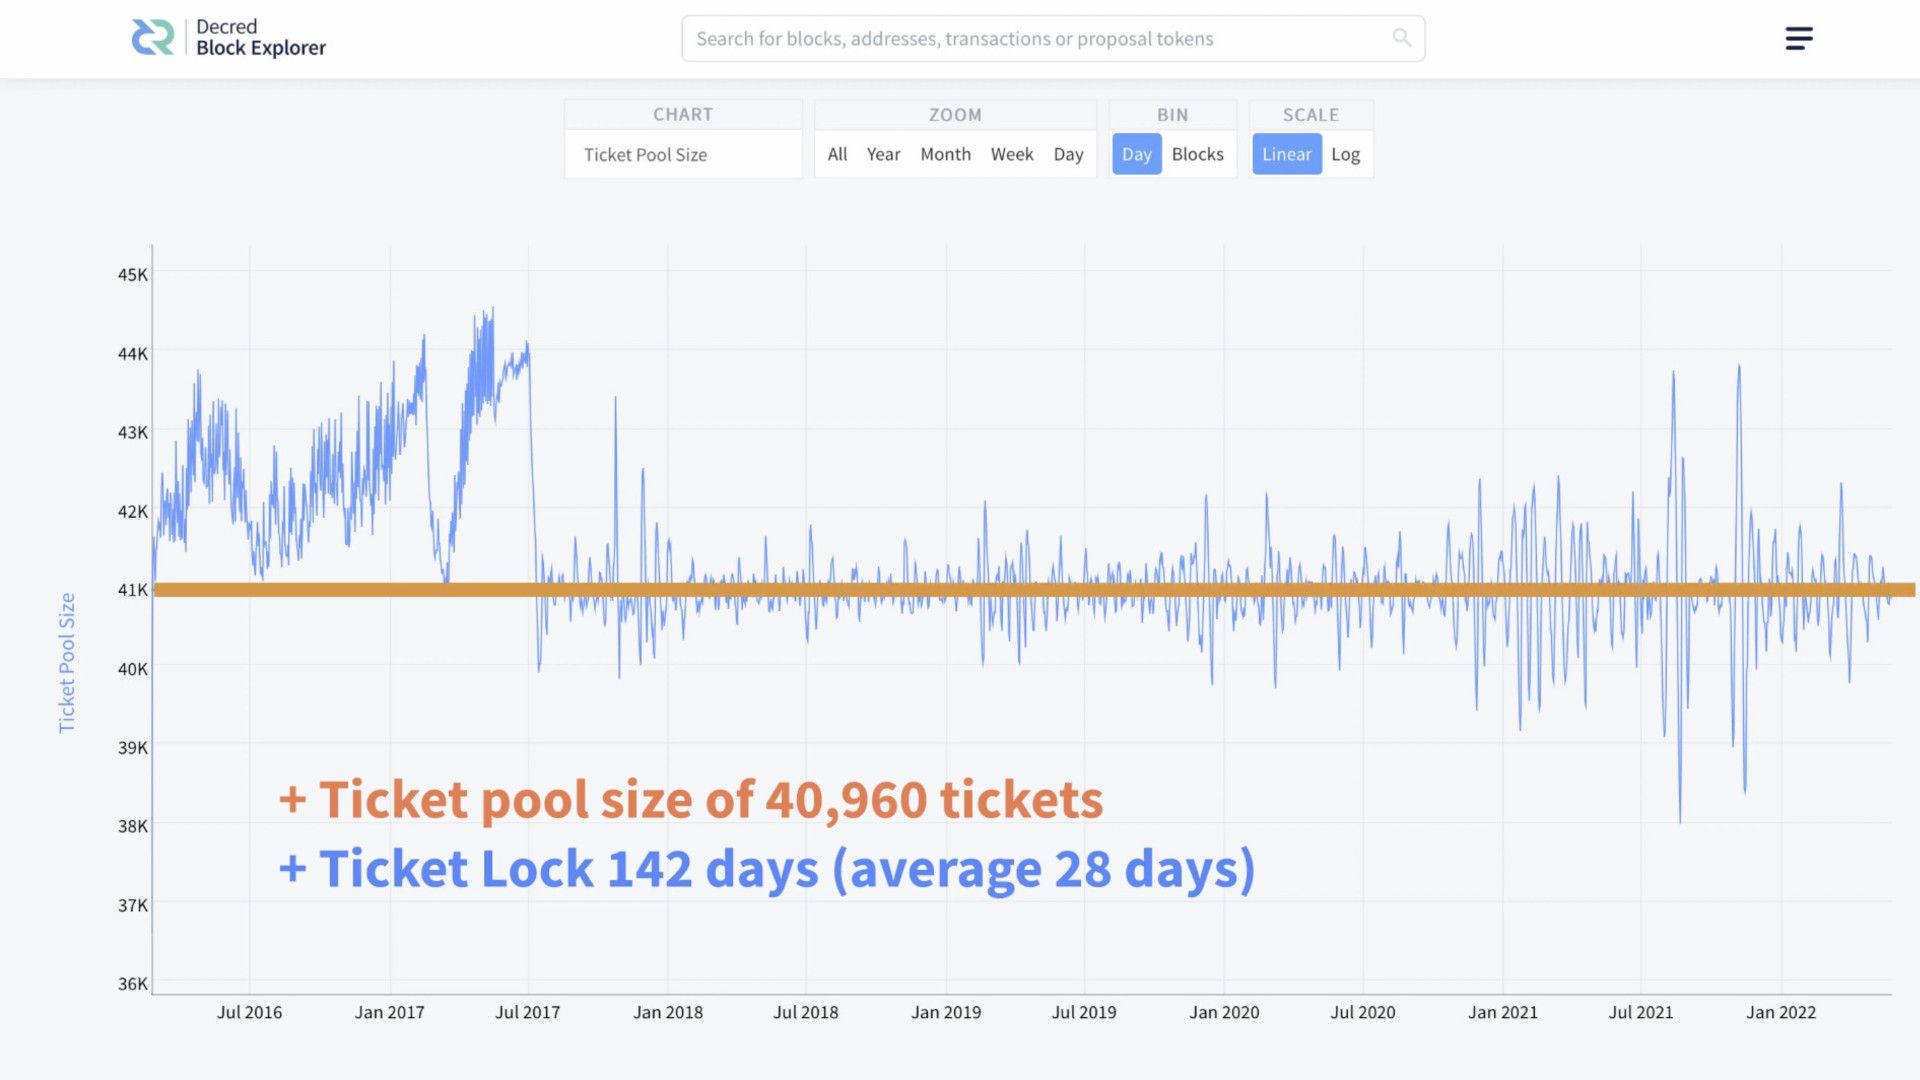
Let’s start with the ticket pool size, Decred aims to maintain a ticket pool size of approximately 41,000 Tickets (or 40,960 tickets). Tickets are locked in the system for up to 142 days and once they vote all funds are released back to the ticket owner with a percentage of the block reward. This effectively means that tickets are in limited supply and people who own tickets have relatively strong conviction. Although the ticket pool size will vary, the aim is to be as close to the 41,000 mark as possible. As long as this condition remains consistent, the system is working as expected.
Areas to pay attention to include the lead up to July 9th 2017, where the chart was frequently out of this range. When you overlay this with the ticket price chart, you can see there were some serious games being played to throw the system out. This issue was, of course, fixed with the ticket algorithm consensus change on July 9th 2017.
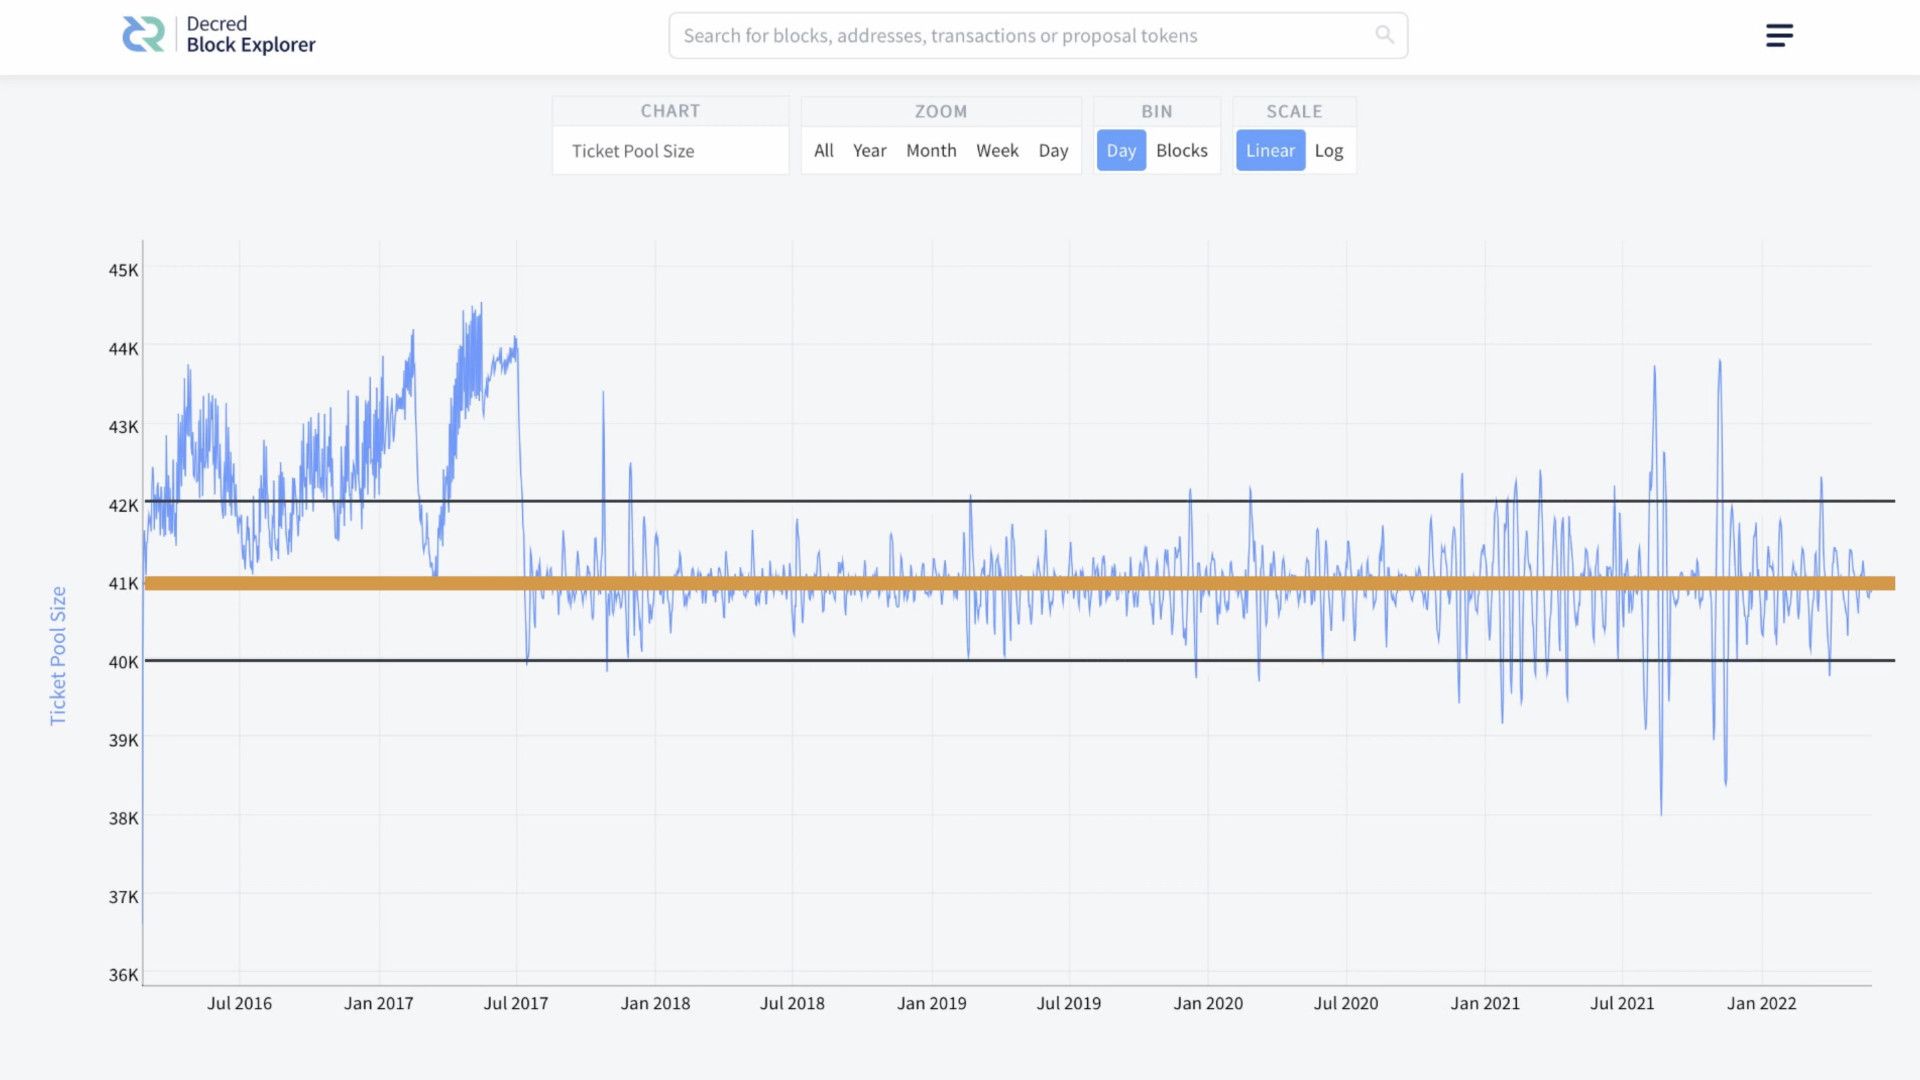
Since then, there are two other notable spikes, August 2021 and November 2021. But what’s interesting here compared to the previous highlight is how quickly the new algorithm corrected. It’s reasonable to expect a deviation of plus or minus the target threshold, but spikes like these can be worrying signals if they continue for long periods of time. As the system evolves, the likelihood is we’ll see less of these big spikes. One recent improvement which, I believe will harden the system, is the automatic ticket revocation consensus change. Now, if tickets expire or miss votes they will be automatically returned, meaning there is no longer a need to do this manually, which in turn reduces the chances of manipulation or human error.
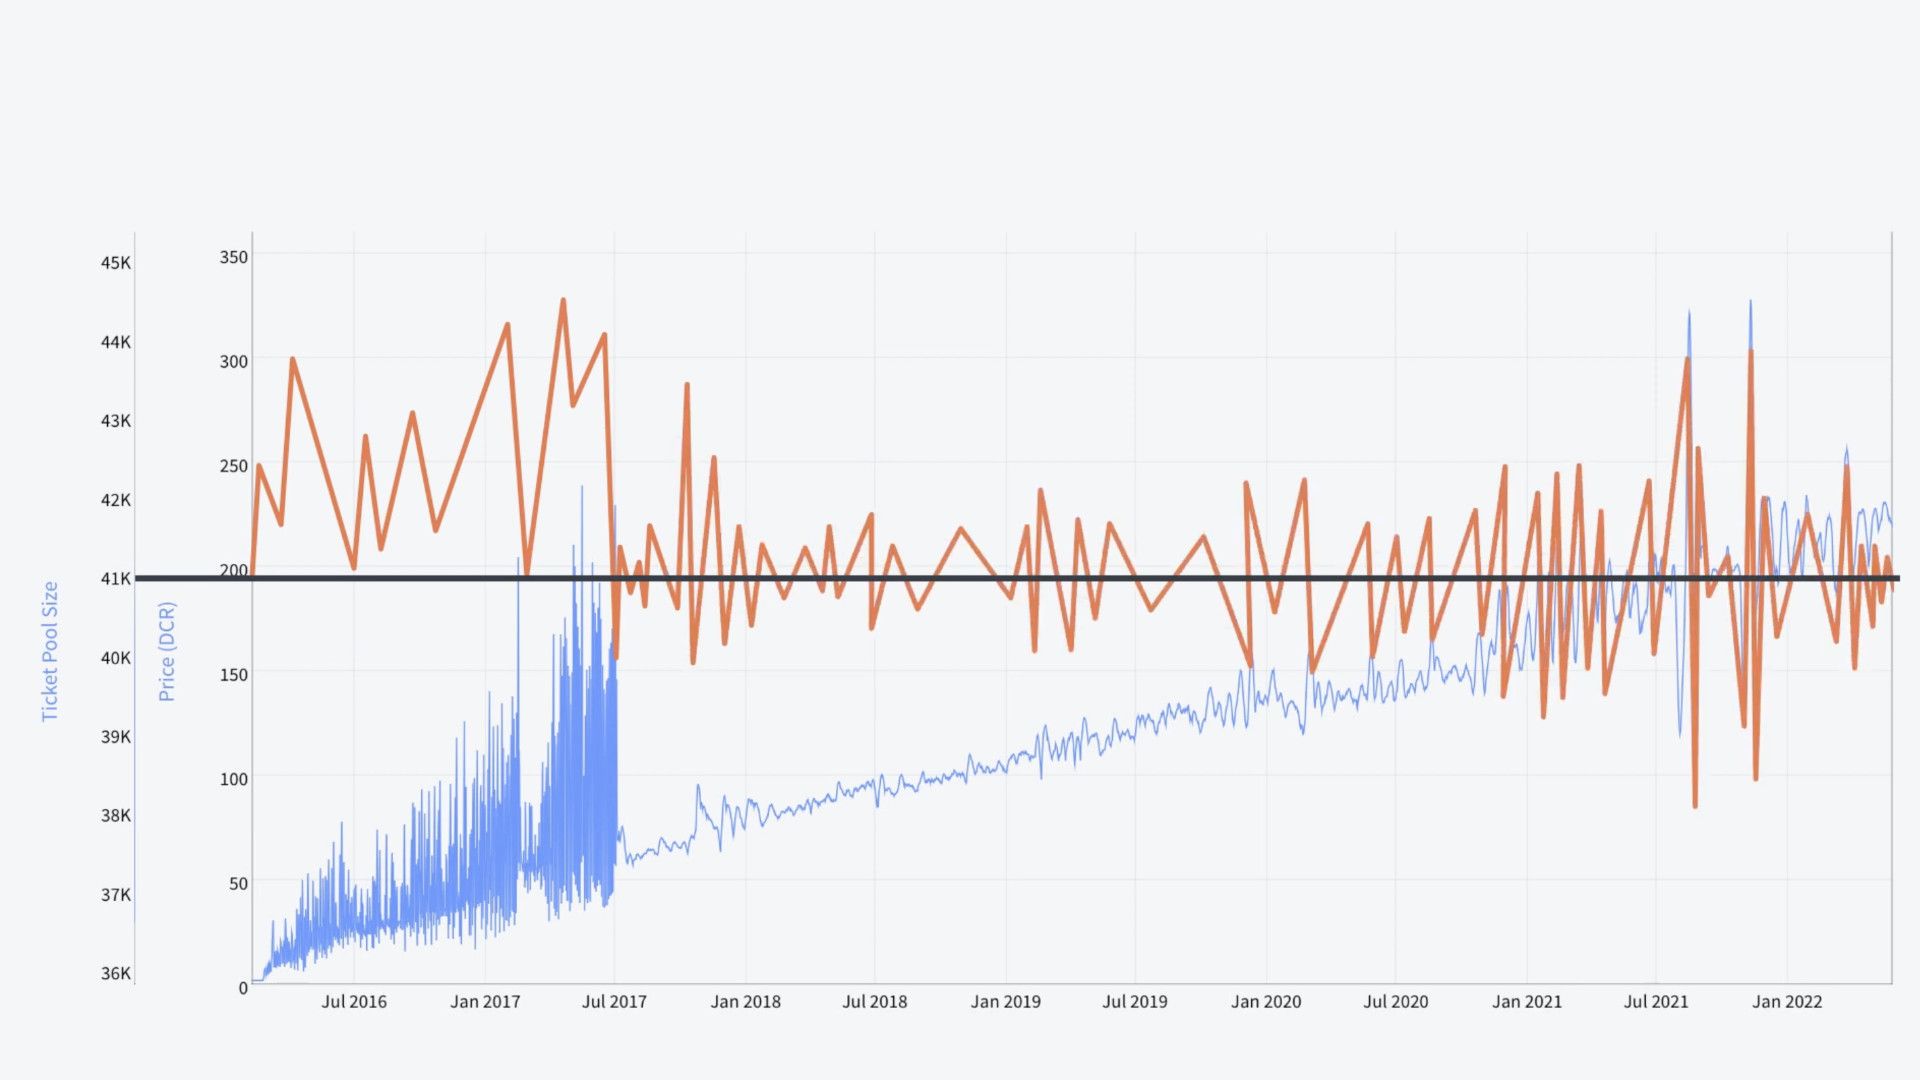
The ticket price, as we’ve seen, is determined be the ticket pool size. As the pool increases, the price of a ticket increases and visa-versa. An important note, is that these corrections are all done automatically, by the algorithm, in ticket price intervals of 144 blocks. Another interesting point, is this algorithm can’t be changed without the approval of the stakeholders. Which, when you think about it, is very impressive, as there is no intervention or manipulation from people wanting to change the system for their benefits. Even more impressive, if this behaviour was happening, you would be able to see it in the data. Once again, the power of the block explorer keeping everyone honest.
A final point, about the ticket price chart, is you can also see how many tickets were bought at a particular price. The likelihood is, there will be more tickets bought when the price drops, but this could also tell the conviction for a curtain price point, e.g. in November 2021 when the price topped 325 dcr there were almost no buyers.
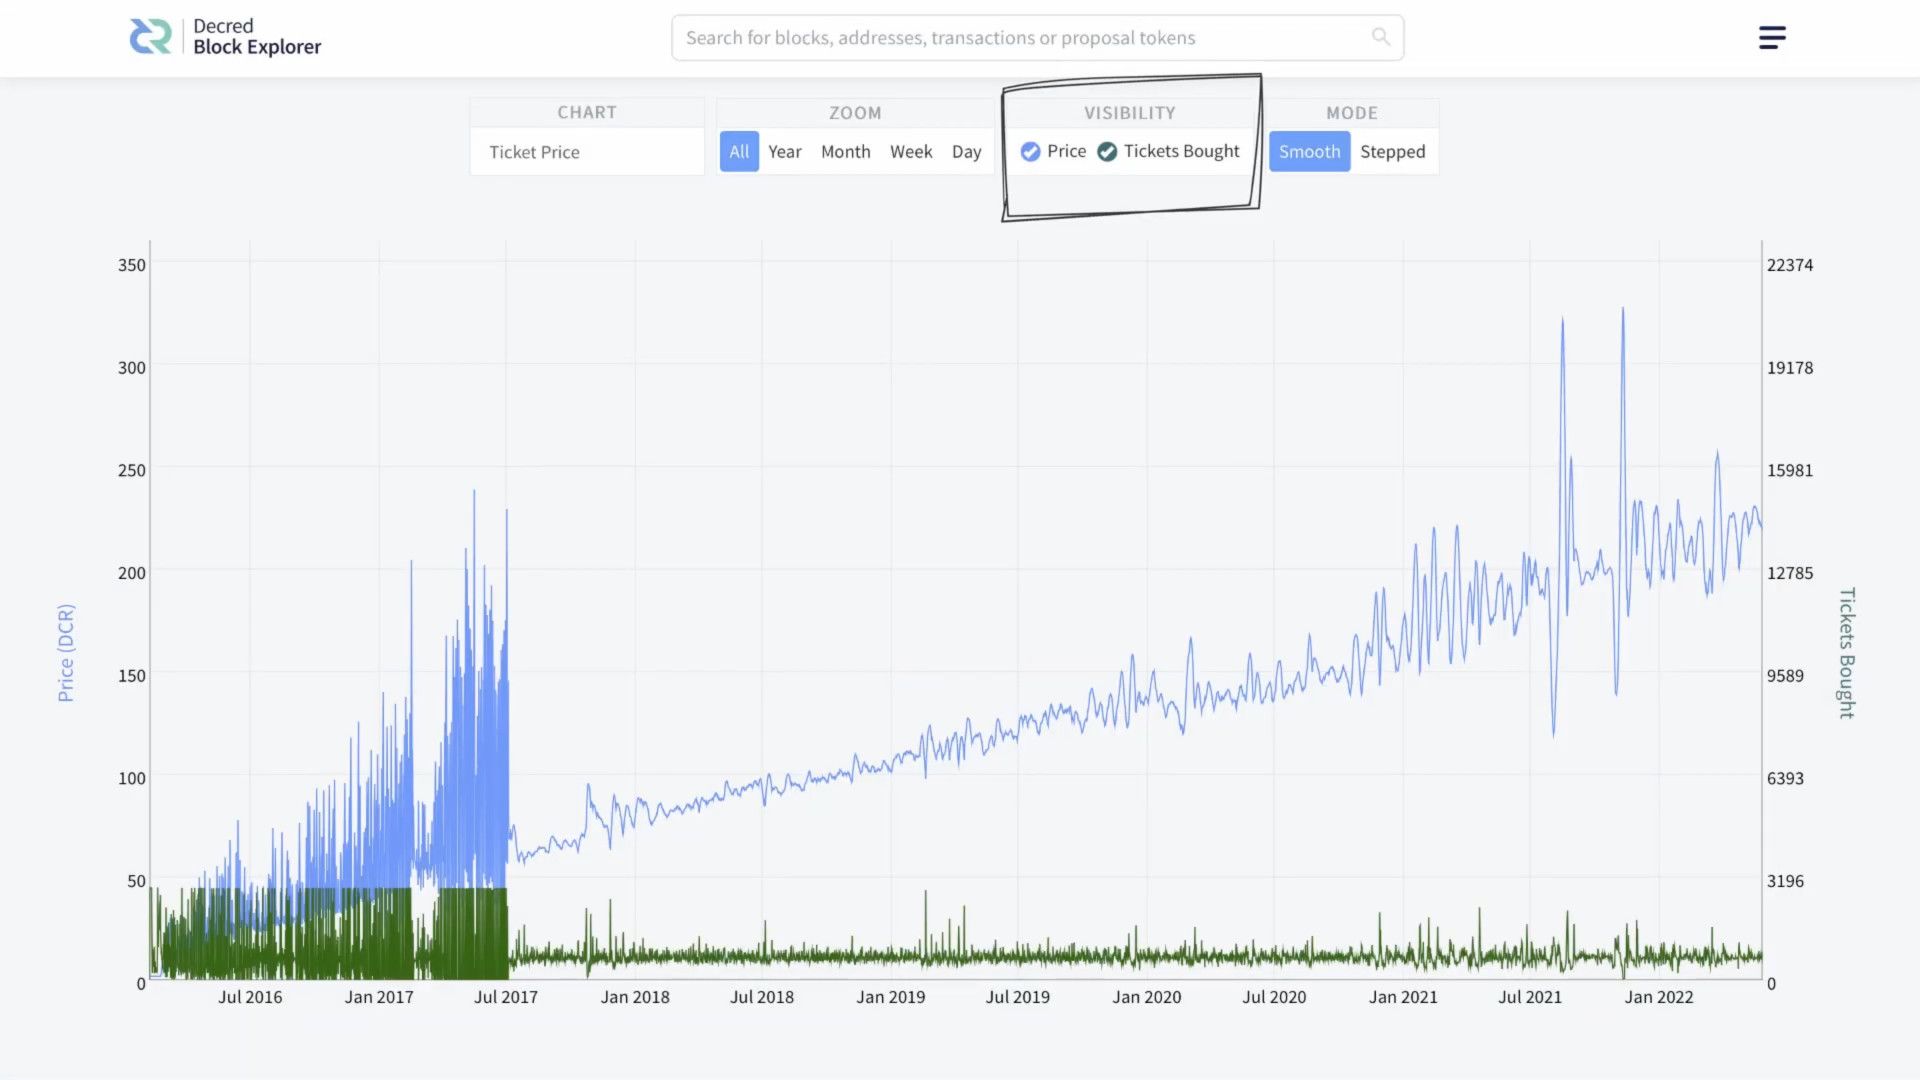
Due to the nature of Decred’s 21 million max cap the highest a ticket price is likely to be is approximately 512 dcr. Currently, with a coin supply of 14 million, the maximum a ticket price can be is approximately 341 dcr. To put that into perspective, the current average price of a Decred ticket is between 200 dcr and 230 dcr.
From this information, it can naturally be assumed that a gentle rise in this chart along with the gentle rise in coin supply is a favourable outcome for the project’s stability.
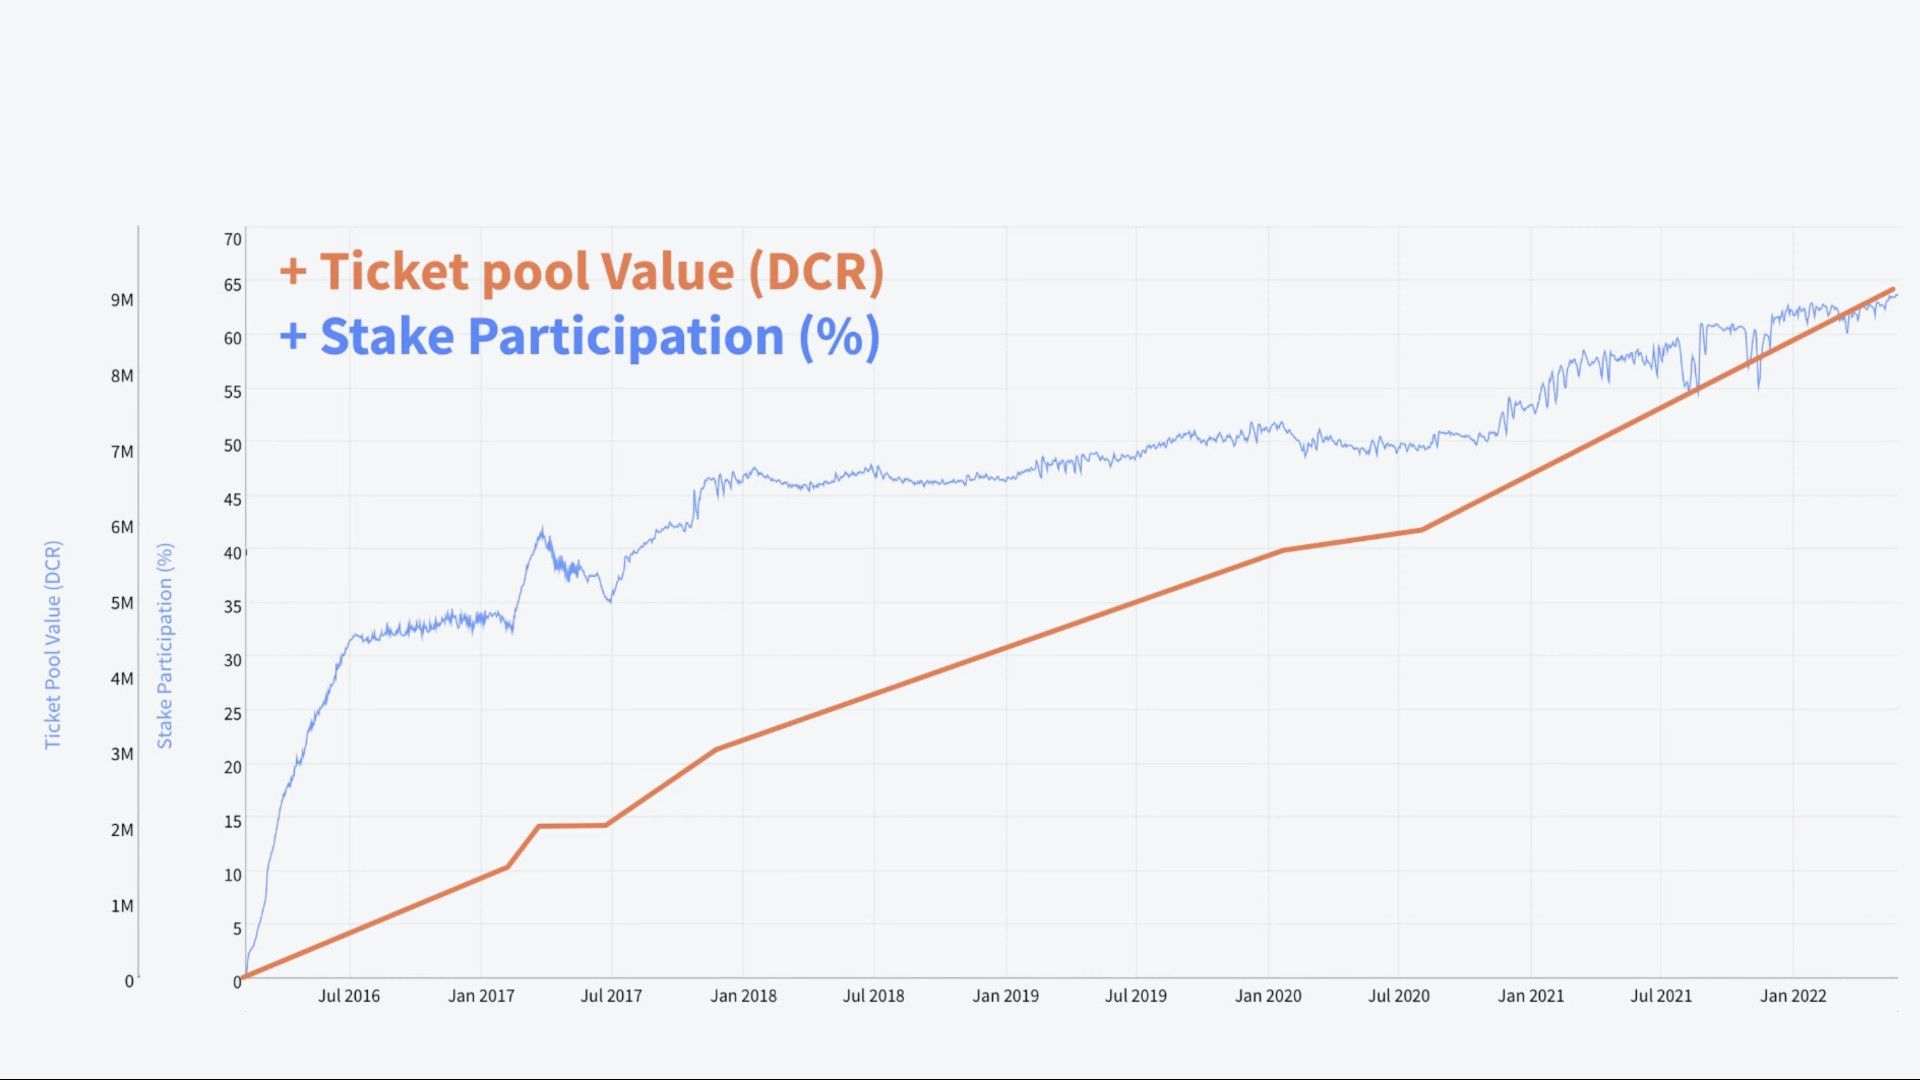
I tend to look at the Ticket Pool Value and the stake participation charts together and when overlayed you can see the % of the coin supply staked along with its dcr value. For the health and security of the Decred protocol, I would expect the participation to be between 40% and 60% of the supply. Above 51% makes the chain extremely difficult to attack as long as the tickets are well distributed.
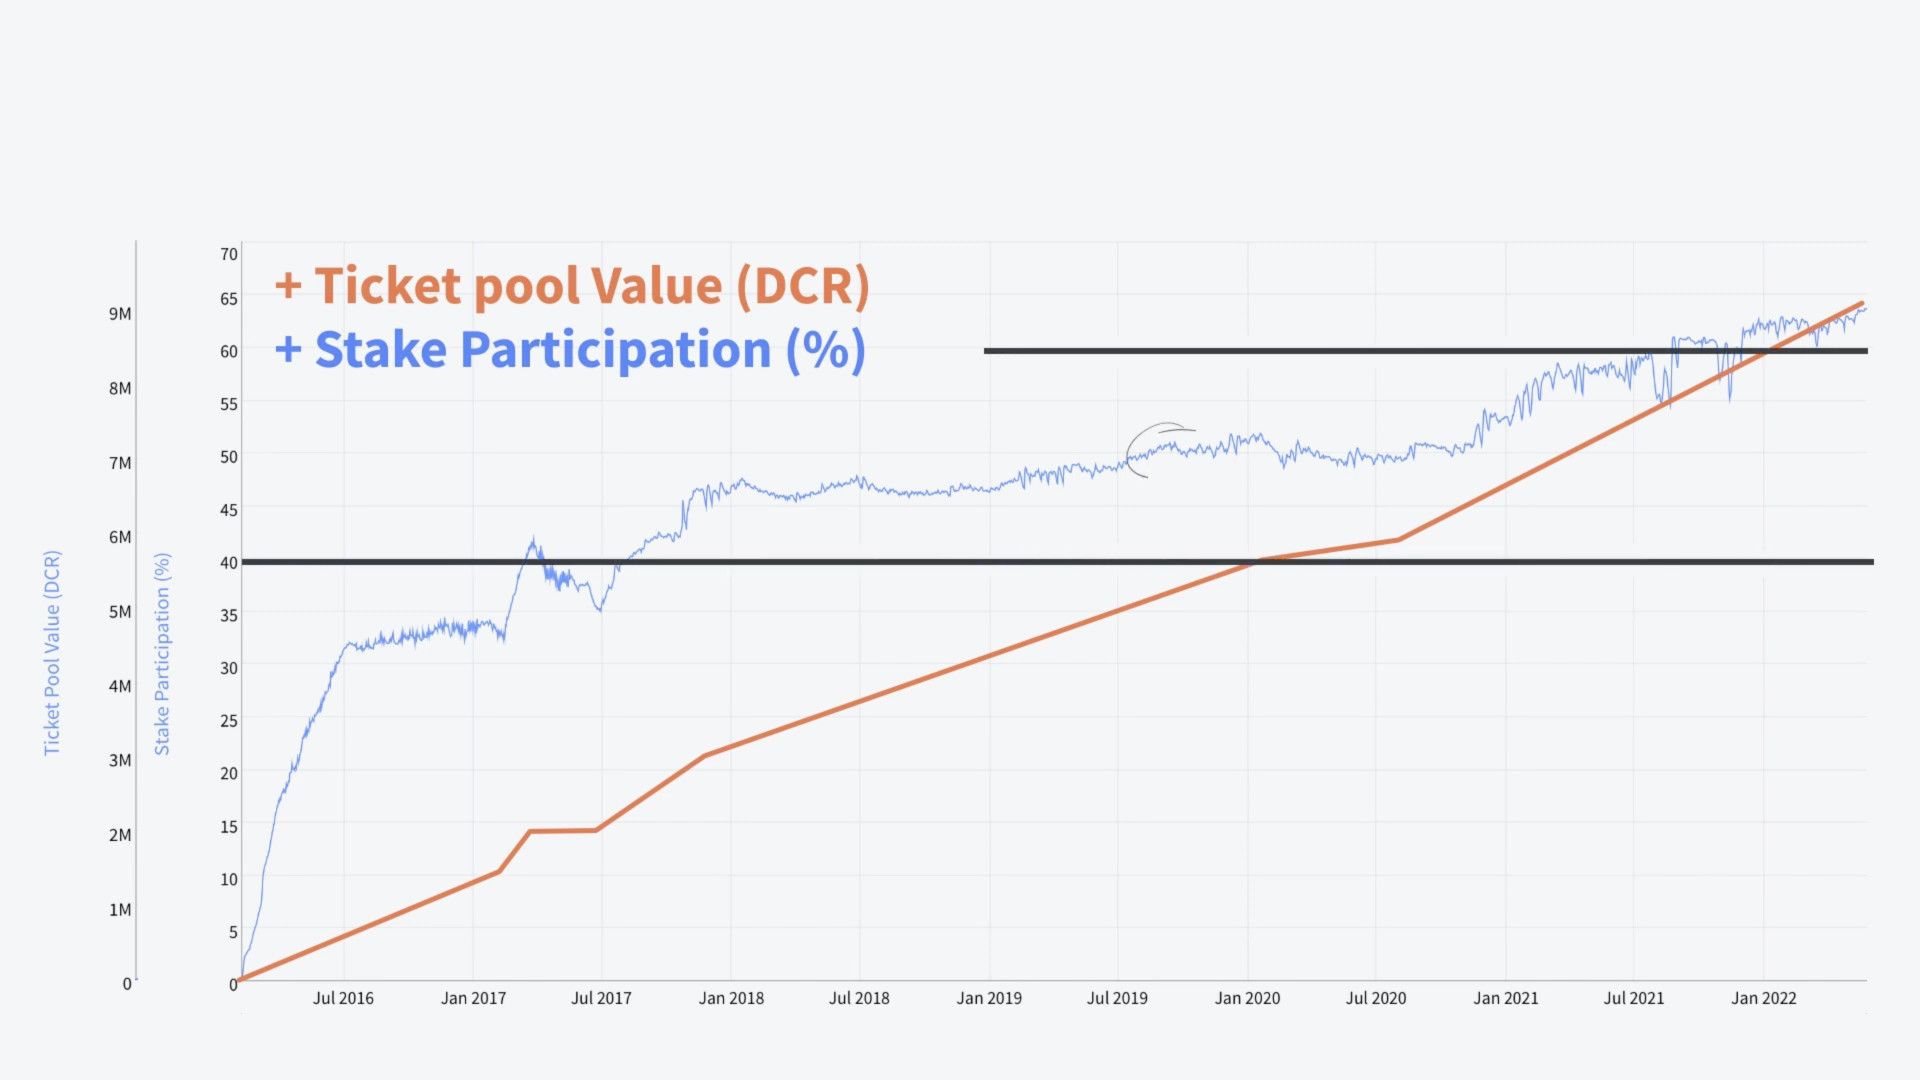
In terms of stake participation, this has been above 40% since July 2017 which shows a large portion of the holders are in this for the long haul. And based on the recent consensus change, in the short term I can see this level going up to 70% which will squeeze the coin supply even further. This is largely due to ticket holders, re-staking rather than selling, which is a side effect of the current high staking reward. Of course, this will correct, once the reward comes down or the price reaches a suitable level and market valuation.
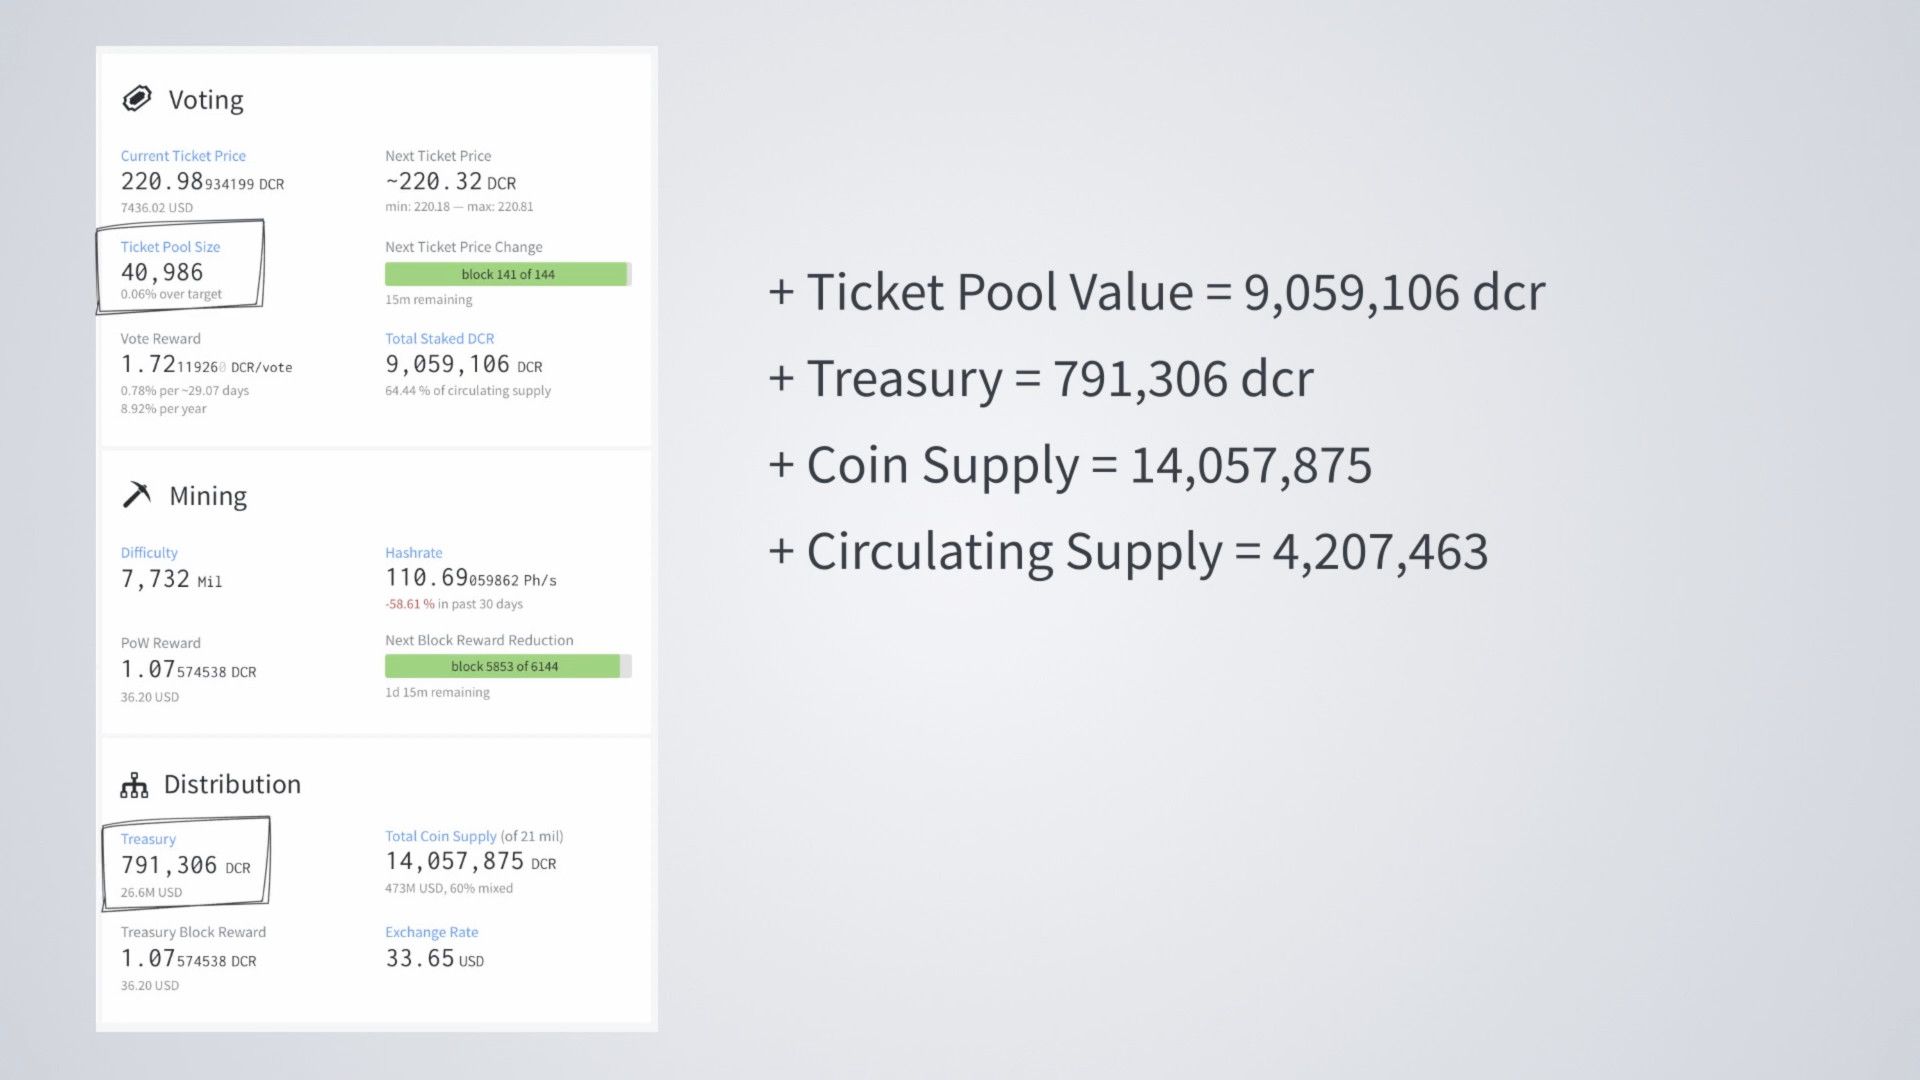
Another interesting thing about the Ticket Pool Value is, currently, when you combine it with the treasury, it has a value of almost 10 million dcr out of the 14 million dcr coin supply. Meaning there are approximately 4 million dcr coins in circulation, and based on the current price it’s not a big jump to realise that even the smallest amount of adoption is going to have an impact.
In the next DCRDATA article, we’ll look at the transaction related charts to investigate the general rate of growth and adoption for the project.


Comments ()