

DCRDATA growth and adoption charts
Everything you need to know about Decred is on-chain! The transaction charts tell the story of increased network participation.
The DCRDATA charts that we’ve looked at to this point demonstrate how the project is performing and how the security is holding up. It’s also fair to say these charts can demonstrate the conviction of the coin holders.
But what we’re interested in, here, is growth and adoption and whether the chain is seeing a general increase in transactions. Decred has several kinds of on-chain transactions we can look at, each tells a slightly different story of adoption or participation.
Types of on-chain transactions include:
- Regular peer to peer transactions
- Privacy mixing transactions
- Block votes
- Ticket purchases
- And revocations
Transaction Count Chart
The Transaction Count chart bundles all of these transactions together. Which means the baseline for each block will start at either 5 or 6 transactions. In this calculation, the treasury reward is considered a regular transaction (as seen in block – #666,989) it’s not uncommon to see blocks with a transaction count of 6, but it's obviously not ideal. On the Decred chain, blocks are produced every five minutes, which means approximately 288 Blocks will be mined each day.
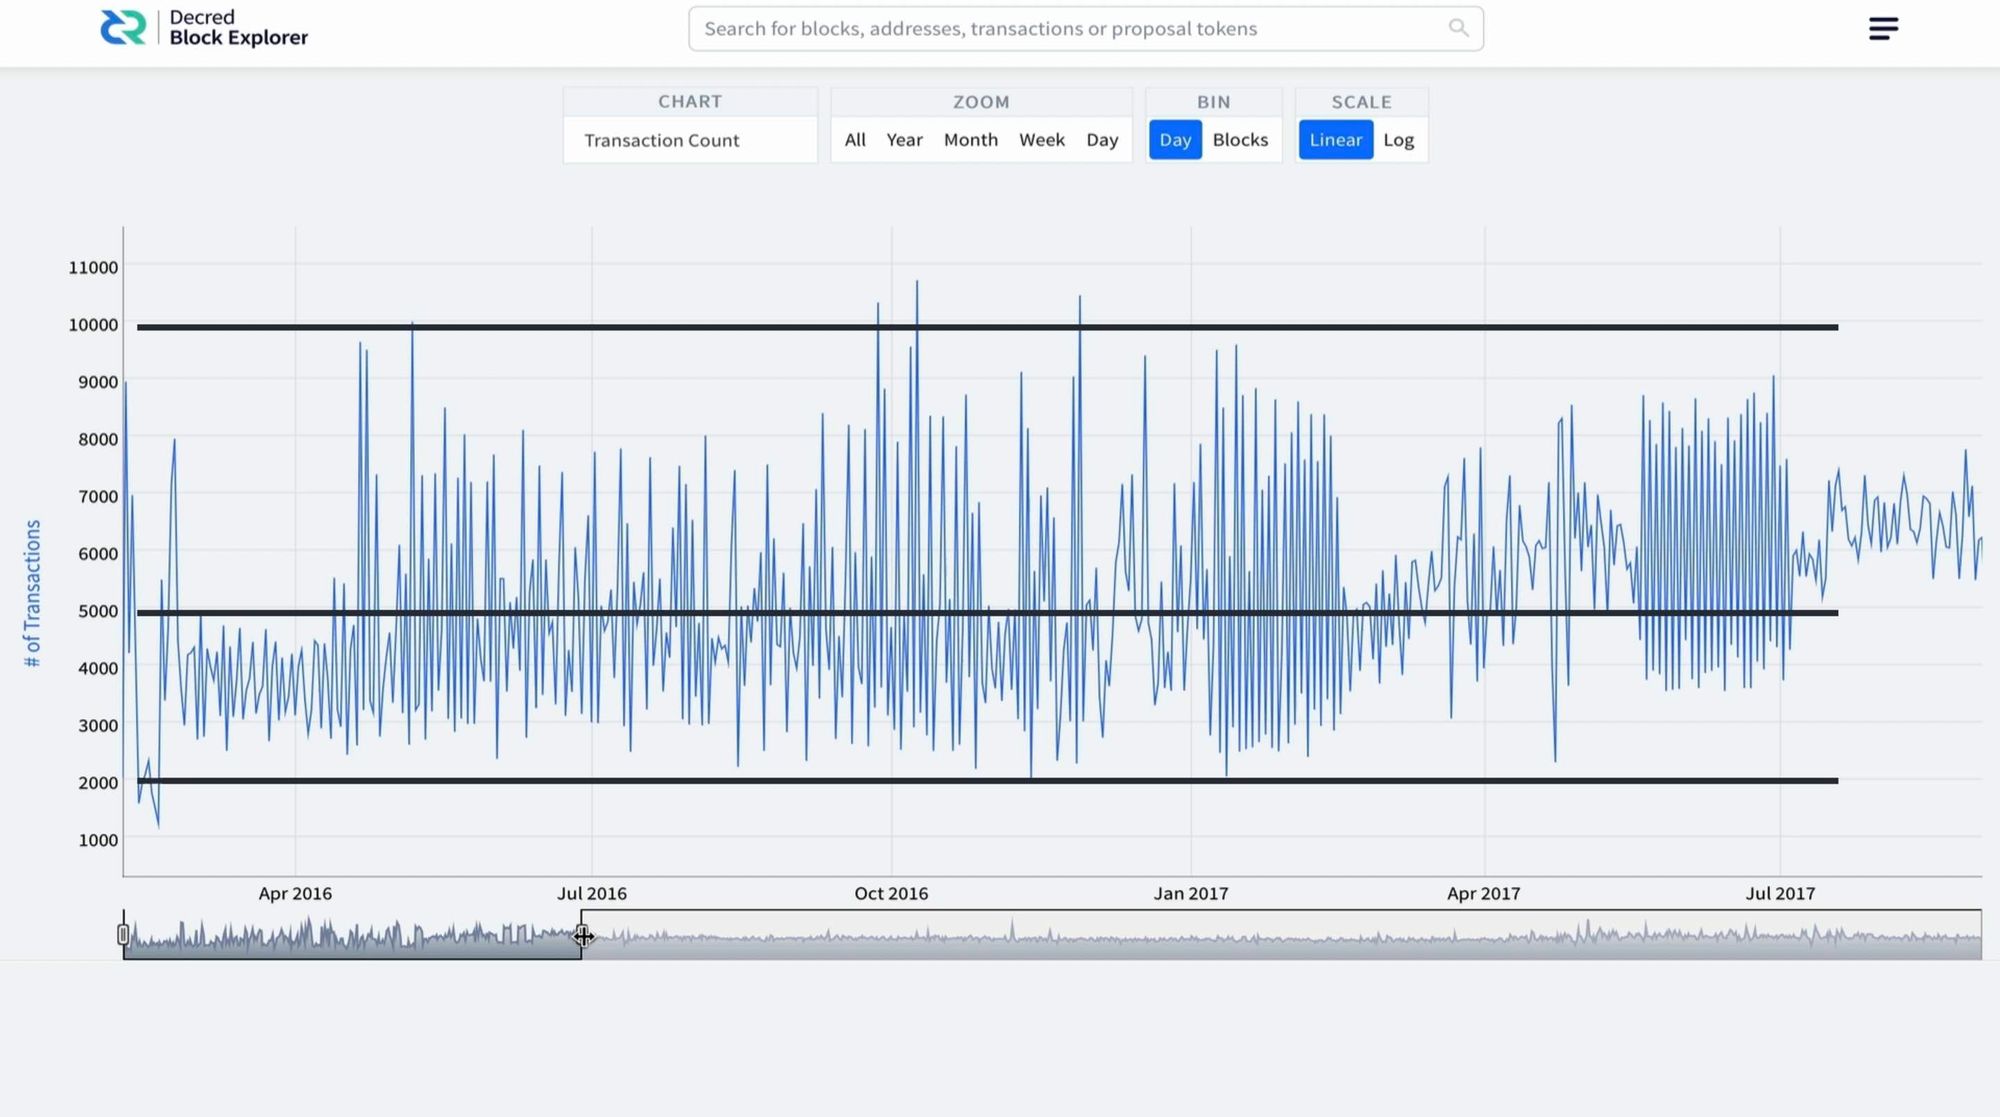
To see if Decred is gaining traction, it's best to look at the daily volume of on-chain transaction. I look at this in three ways – Lows, averages, and highs. But I gain the most information from the lows.
To start, I look at the range, before the end of July 2017. Initially, the chart looks very active, until you realise the extreme highs are also followed by extreme lows. At this time, the daily Transactions on the low side were approximately 2,000. The average was approximately 5,000 and the Highs were approximately 10,000. It’s the lows that tell the actual story, and as you delve deeper, you’ll see the transactions are related to the games being played with ticket purchases. This was, of course, corrected with the July 2017 Ticket Algorithm consensus change discussed previously. At this time, it’s the lows that serve as the best indicator for adoption going forward.
The next range is, September 2017 through to January 2021. During this time, we see a lot of consistency. Decred’s average daily transactions are approximately 4,500 with lows of 3,141 and highs of 9,214. In this range, the lows and averages show there’s a strong user base which has stayed constant throughout this period and has even had a small increase year-on-year. Even more impressive, this period was during an extremely harsh bear market.
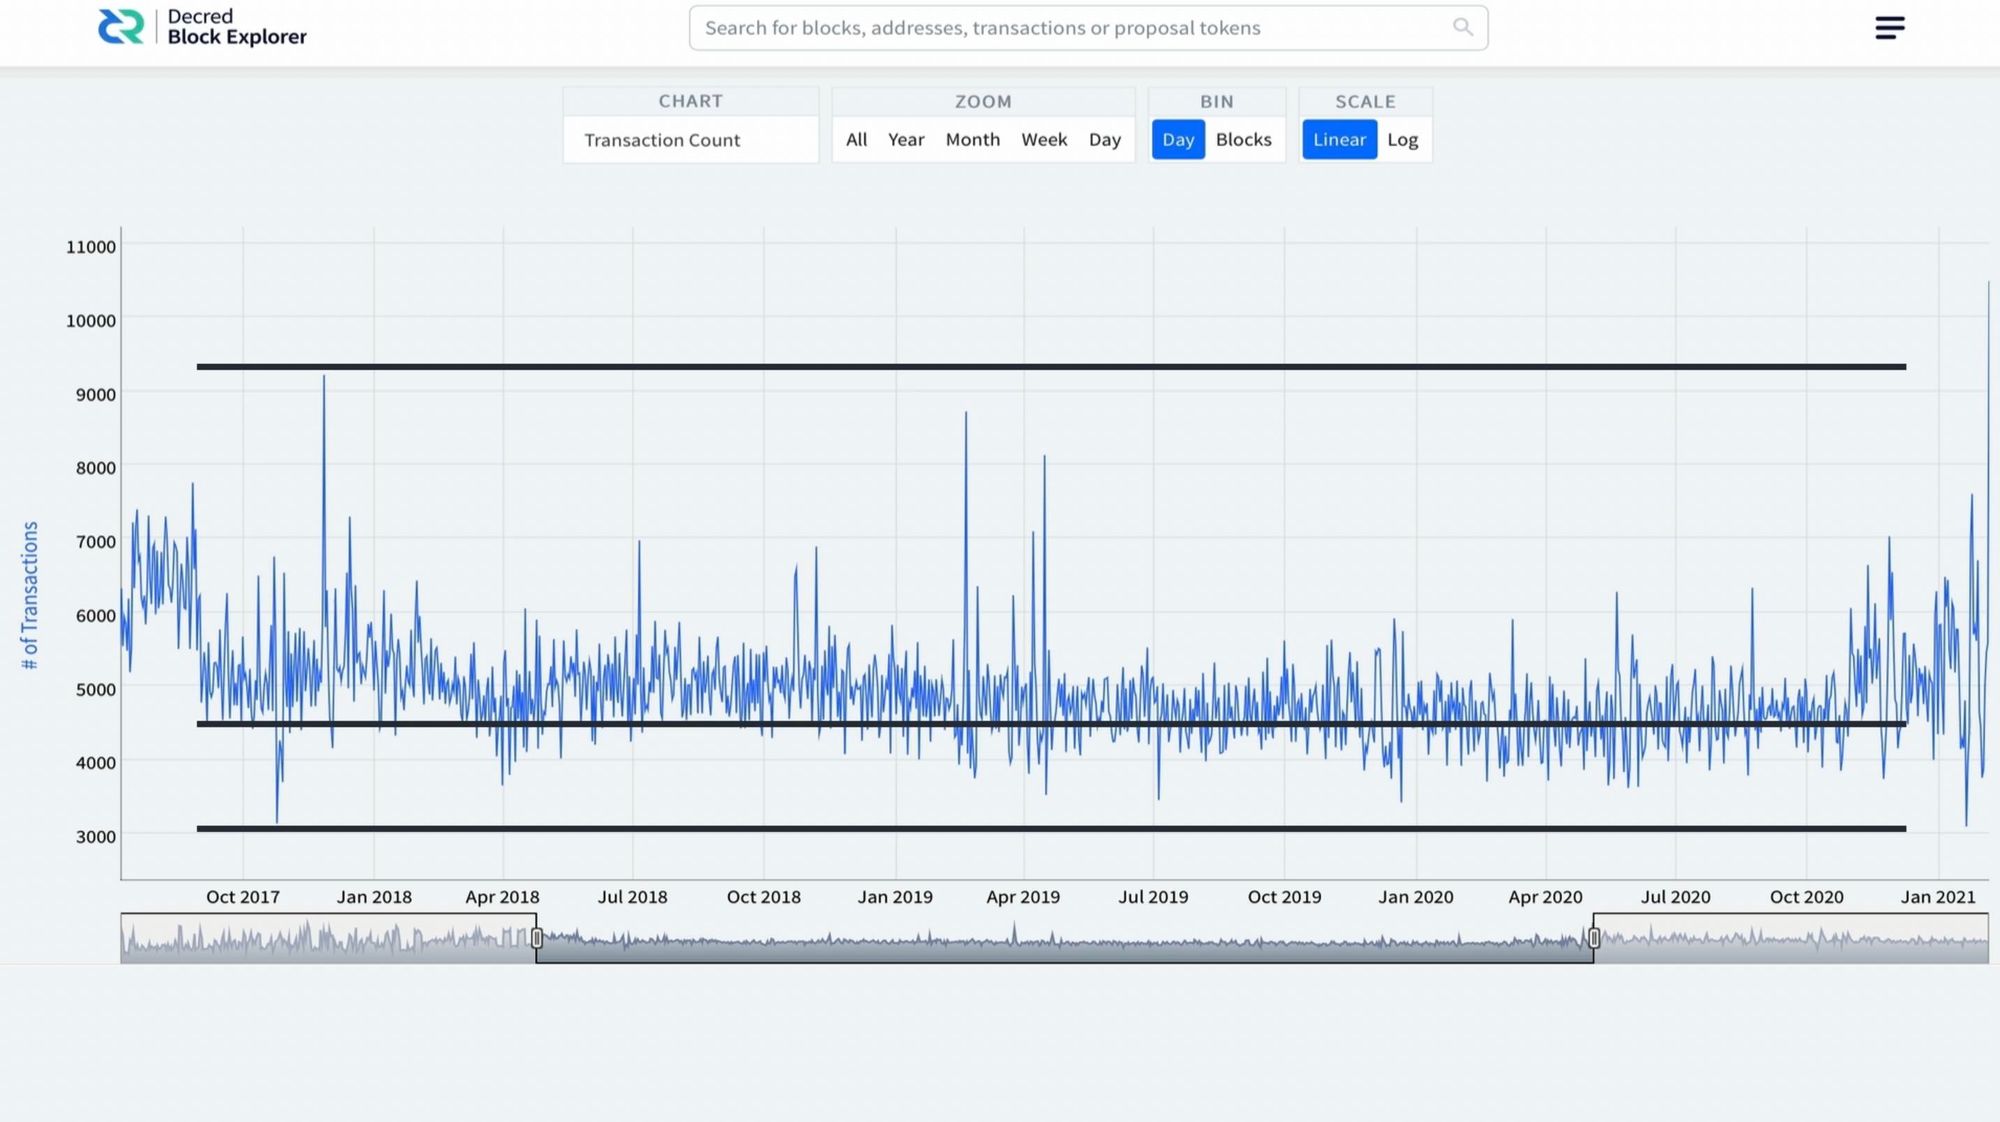
The final range, is January 2021 through to June 2022. This period in contrast was during a bull markt where at one point the price of an individual dcr coin was $250 from lows of $10. During bull markets, it can naturally be assumed there will be a massive up tick in user participation. What we now need to look for is how many of these participants remained, since we entered the current bear market. For this, we can look at the range after December 2021 to see if there is an up tick in participation compared to the 2017 to 2021 range. As you can see, our Lowest daily transactions are 3,839. Average daily transactions are approximately 5,000 and the highest is 8,153. What’s good to see here is both the lows and averages have increased since the previous range.
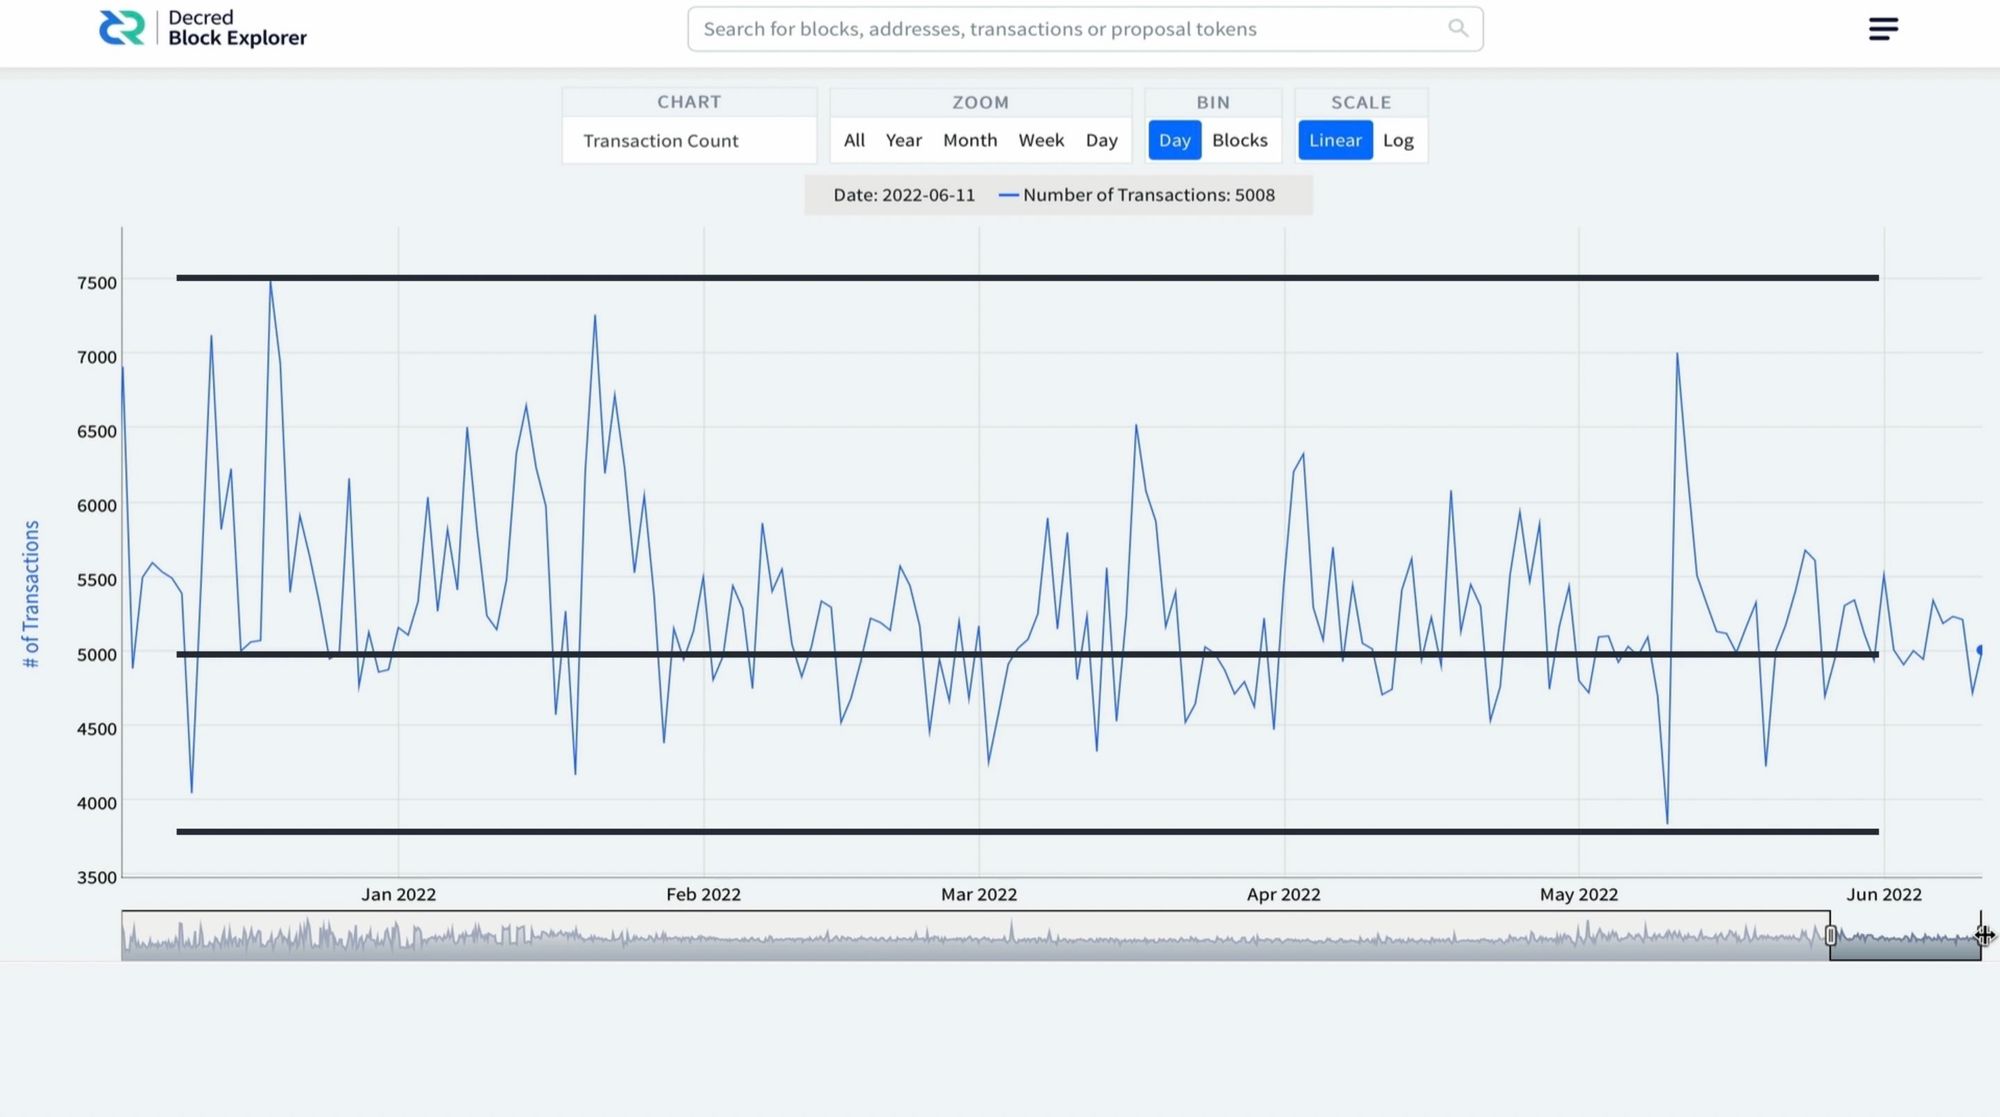
This data isn’t conclusive, but it does give a good impression that the chain is slowly gaining adoption. Another factor to take into consideration is, centralised exchanges and layer two transactions are not recorded as on-chain data, so this information won’t show up in these charts. On the other hand, transactions from Decred’s decentralised exchange DCRDEX will show up in this data and might even be a prominent reason for the up tick in participation since its initial release in October 2020.
Blockchain size chart
Another consideration, Decred is very conservative with the information it wants to store on-chain. This is to try and keep the overall size of the blockchain down so as many people as possible can participate, for example, running fully validating nodes. The size of the Decred chain can be seen in the Blockchain size chart. After six years of running, the Decred chain is still below 10Gb’s in size, which means it’s still feasible for anyone to participate.
As a quick comparison, these similar projects have the following blockchain sizes:
- Bitcoin (BTC) = 410 GB
- Bitcoin Cash (BCH) = 217 GB
- Monero (XMR) = Approx 100 GB (pruned 30 GB)
- Zcash (ZEC) = 31 GB
- Dash = 35 GB
- Horizon (ZEN) = 56 GB
Block Size Chart
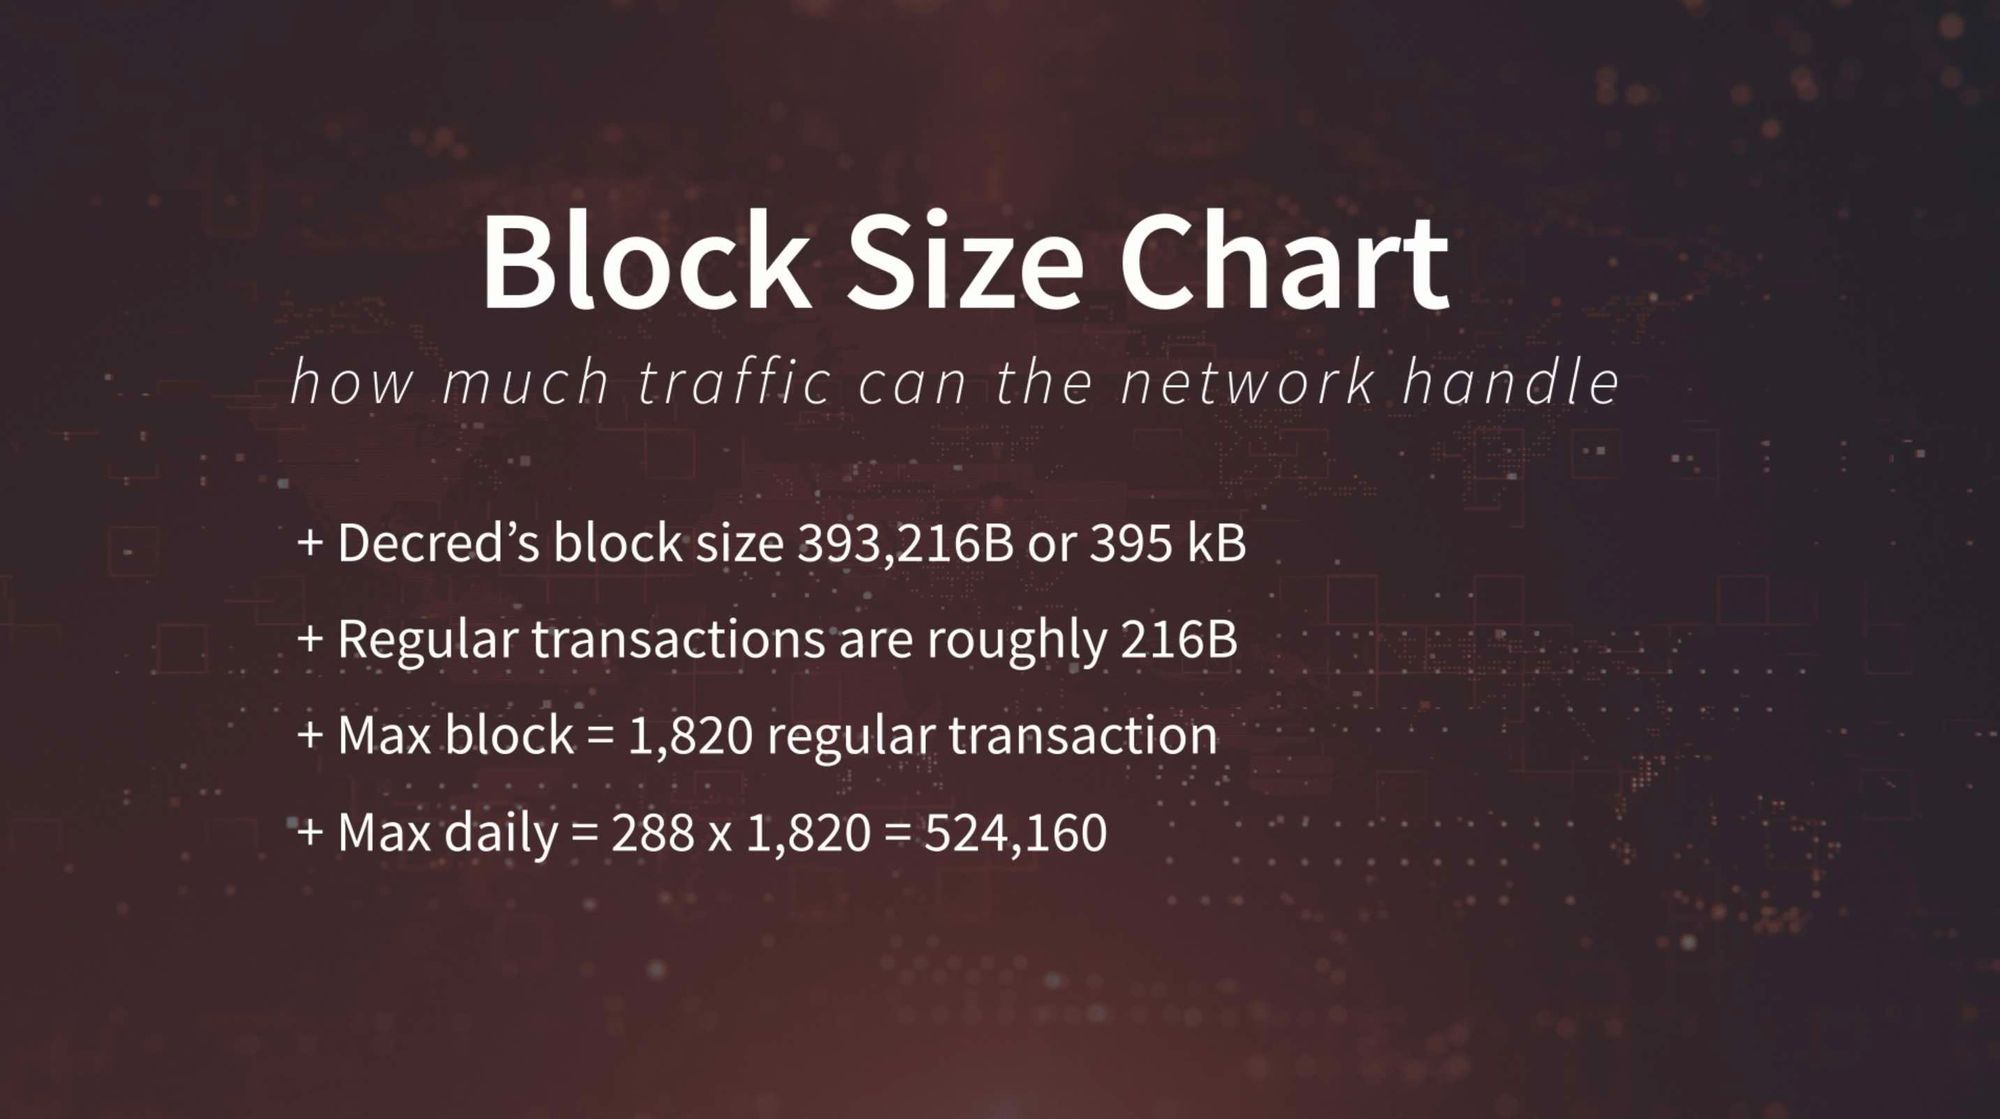
Another aspect of these adoption statistics is how much traffic can the network handle. Clearly we are some way from becoming congested, but nevertheless it's worth understanding what this looks like and also to remember that not everything has to go on-chain.
Decred’s block size has a maximum size of close to 400 kB (393,216B or 395 kB each transaction is roughly 216B = 1,820 transactions per block) which equates to approximately 1,820 regular transaction per block (Decred’s Biggest block to this point = 1,594 transaction (block 529,139). That means Decred has the potential to process approximately half a million transactions a day (288 blocks x 1,820 = 524,160). If capacity approaches this point on a constant basis, it's also worth noting that Decred’s lightning network is capable of taking weight from the system by processing smaller transactions, with a much higher throughput.
Fees
The final consideration for full blocks is fees. It’s also a fundamental reason why Decred aims to only put vital information on-chain and constantly investigates how to make transaction data more efficient. As you can see from the fees chart, the average fee per block is constantly below 0.001 dcr, or approximately 3 cents per block. If blocks become full this fee will rise, this is the same for all blockchains with a maximum block size and scheduled block rate.
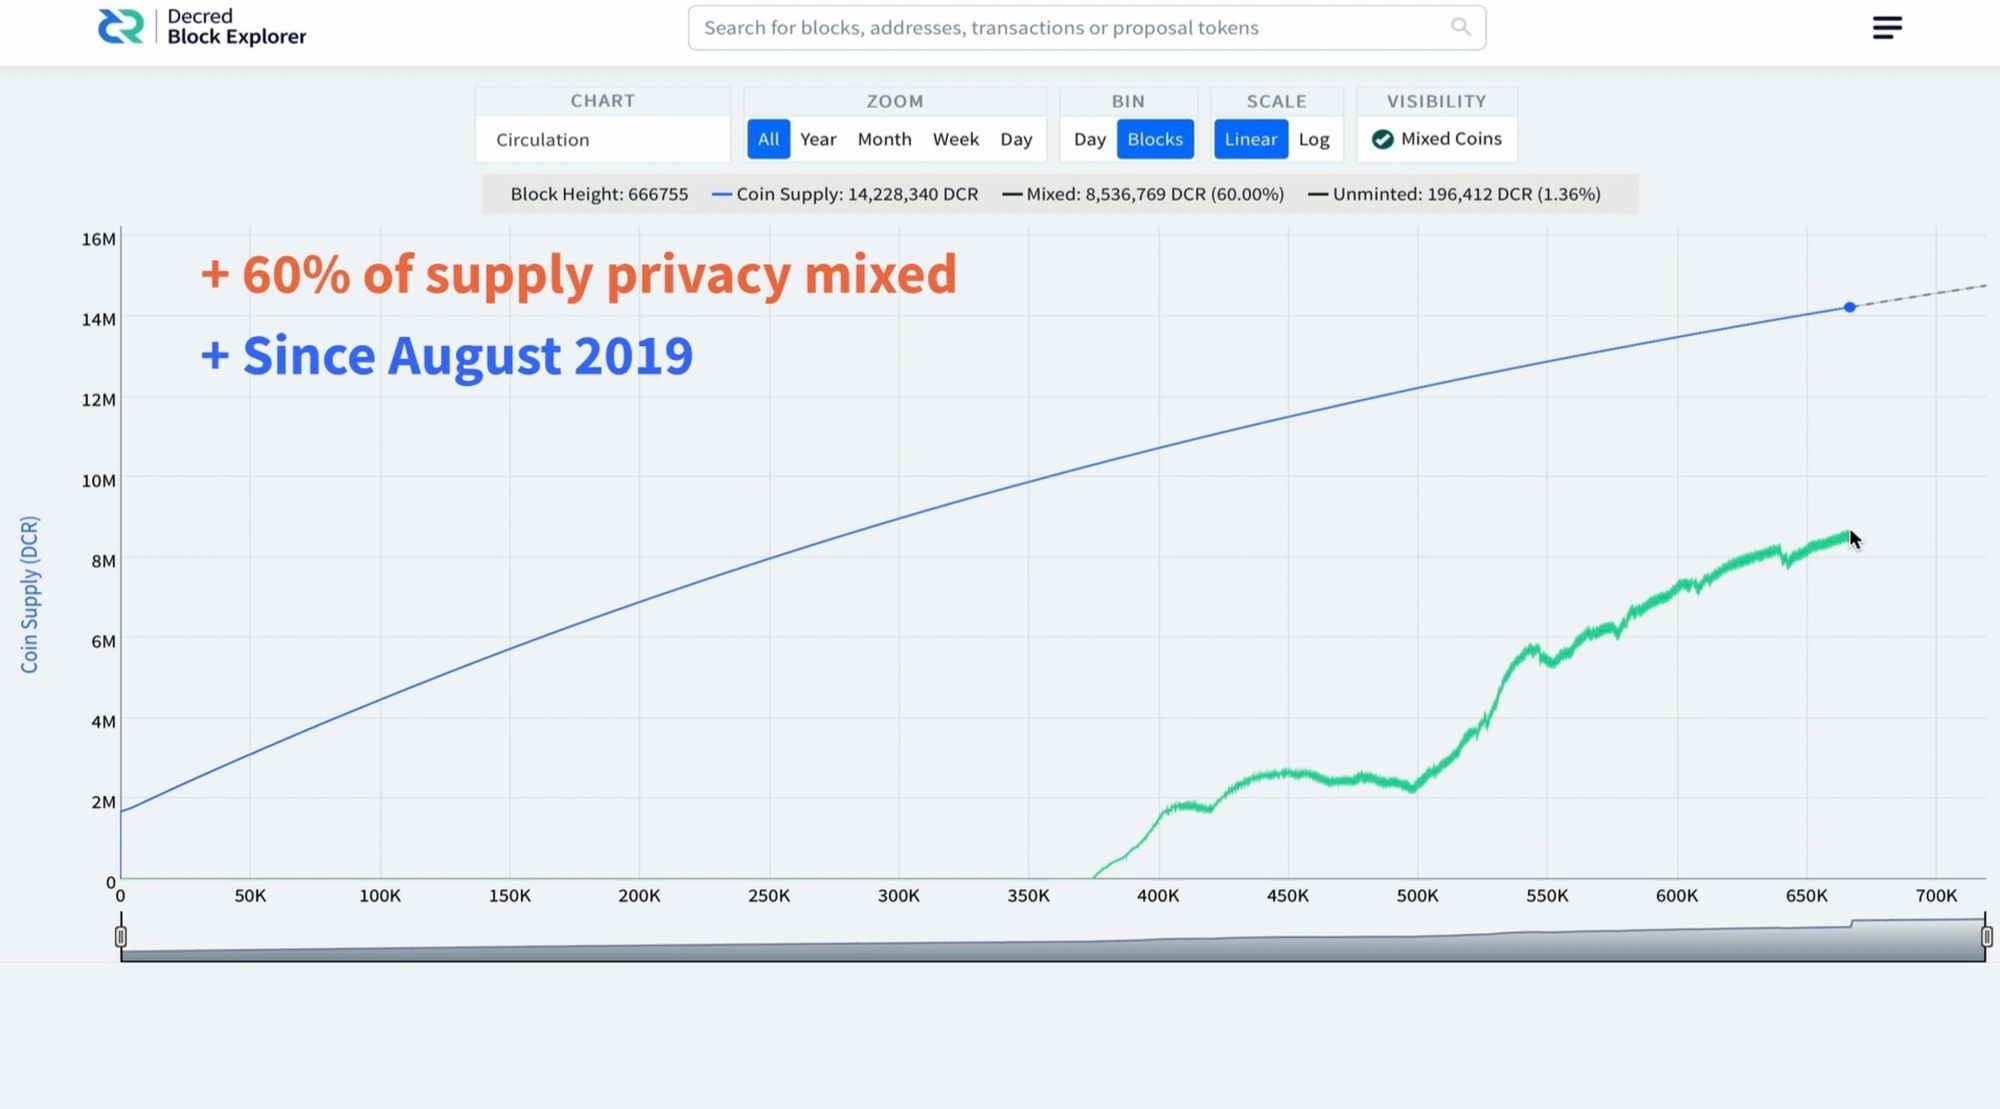
Privacy Participation / Circulation and mixing
The final charts to look at are for privacy participation. Privacy is a big aspect for cryptocurrencies because all coins in the system need to be treated equally. If we look at the circulation chart and turn on the Mixed Coins button, you can see what portion of the supply has been privacy mixed. This service was turned on in August 2019 and since then, the participation rate has grown significantly. After just three years of running, almost 60% of the supply has been privacy mixed.
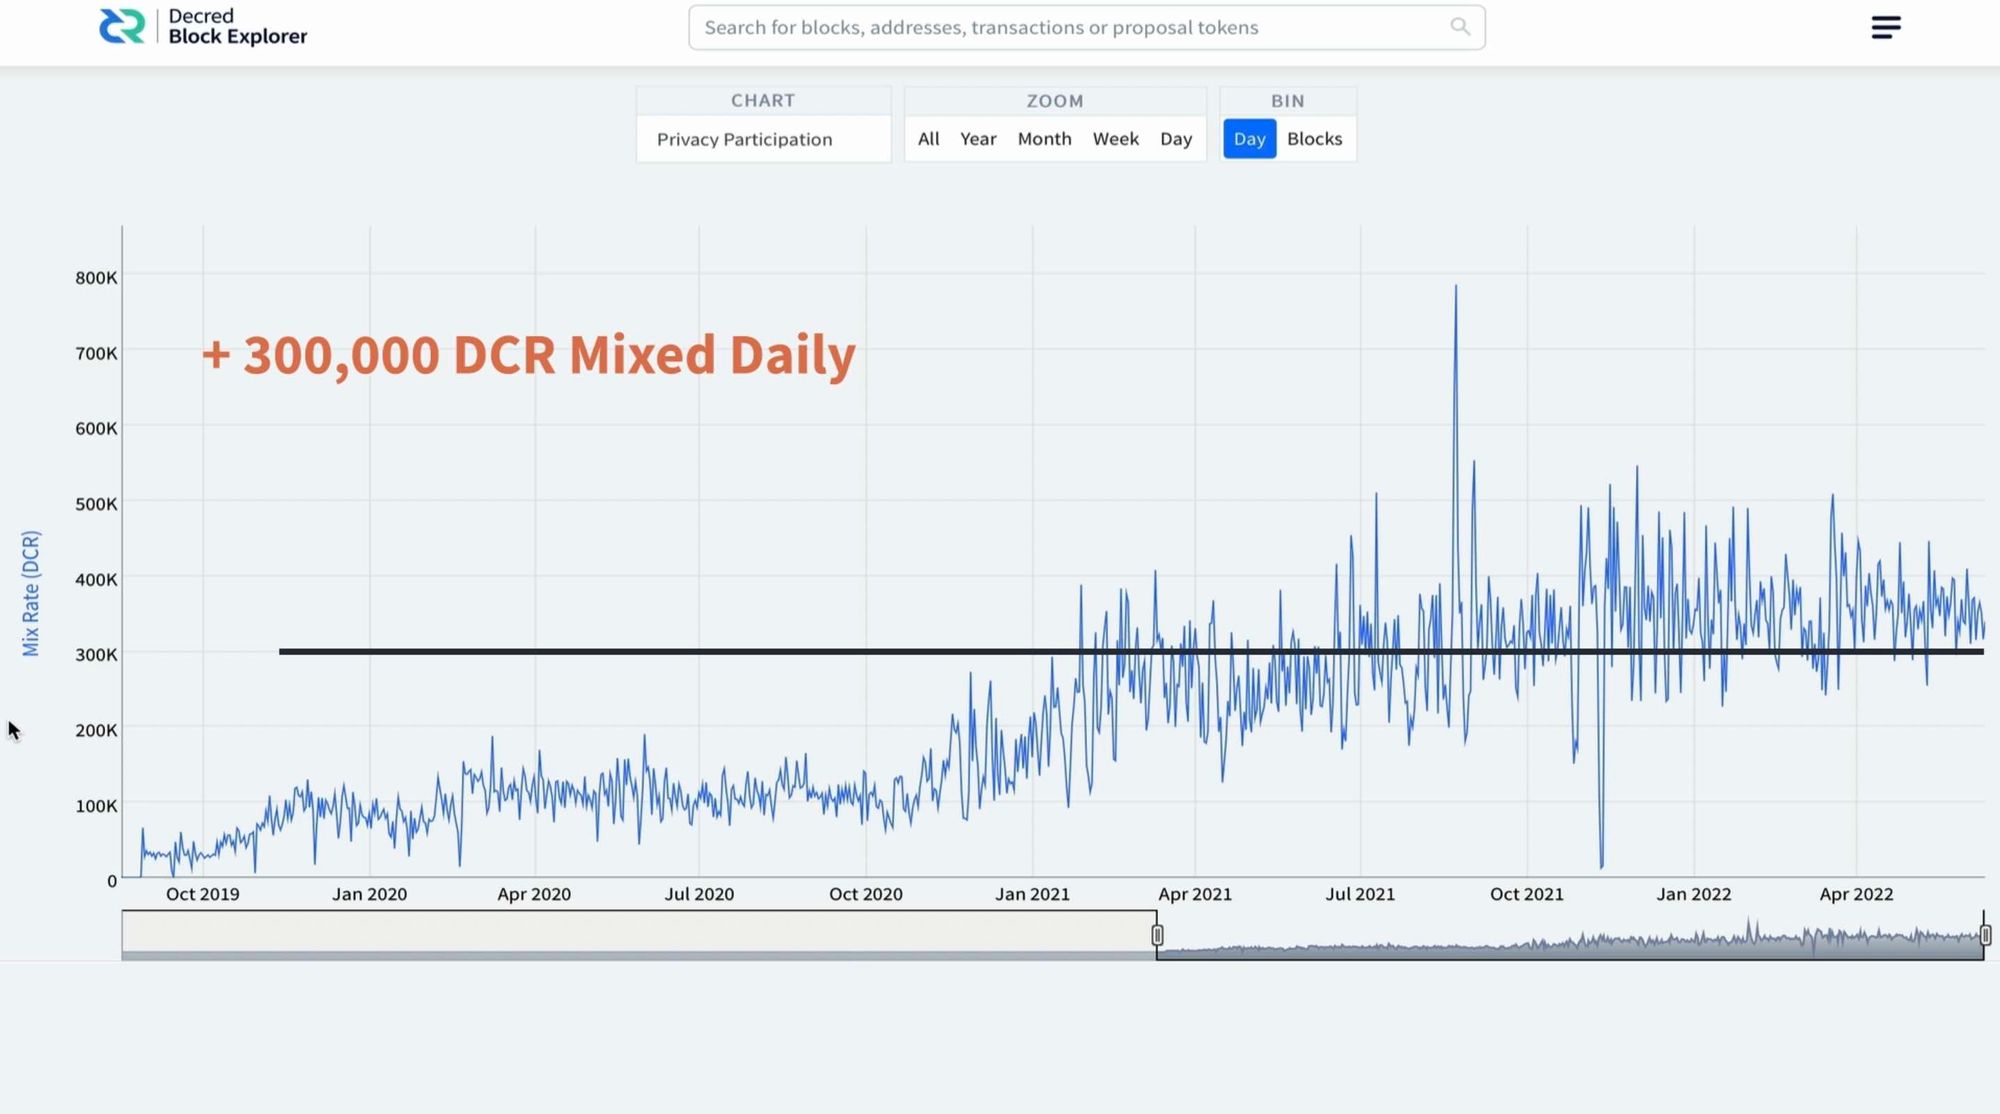
This is also a great demonstration of a strong user base. If you look at the privacy participation chart, you can see more than 300,000 dcr coins are privacy mixed daily. Decred’s privacy mixing service has a very high throughput due to being combined with the stake pool, which currently has over 9 million coins run through it over the course of 142 days.
Conclusion
What’s clear from these charts is, Decred has an active network that has steady and reliable growth and has continued this pattern from genesis. Some would argue that the growth of the project isn’t fast enough, and not enough is happening to accelerate this further. But it’s my option that building innovative technologies takes time and at all costs security should be at the forefront of every effort. It’s also important to note that Decred isn’t a copy and paste platform, everything has been built from scratch including DCRD, which is the fully validating chain daemon the Decred platform runs on.
I also believe that Decred is on the turning point of innovation where we’ll see products built that increase participation 10-fold. This is evident in the development of DCRDEX that gives Decred a way to interact with other chains without the need for third parties or centralised entities. What comes after this, I expect, will be general production tools and frameworks. I also believe these tools will be the basis for the next step in Decred’s evolution and will offer a lower barrier to entry for new developers, merchants, and enthusiasts.
In the next episode of our DCRDATA series, we’ll look at comparing some popular block explorers and the data on offer to general users.

Comments ()