

There and back again
This has all the signs of market bottoms. Is this the bottom? or is it just halftime? Let's break it down and see how bullish the signs are!

A bear market's tale.
Obligatory: this is not financial advice and I am not a financial advisor.
It's been another two weeks since my last post and the markets still look bleak but if I'm being honest I'm feeling pretty bullish.
DXY
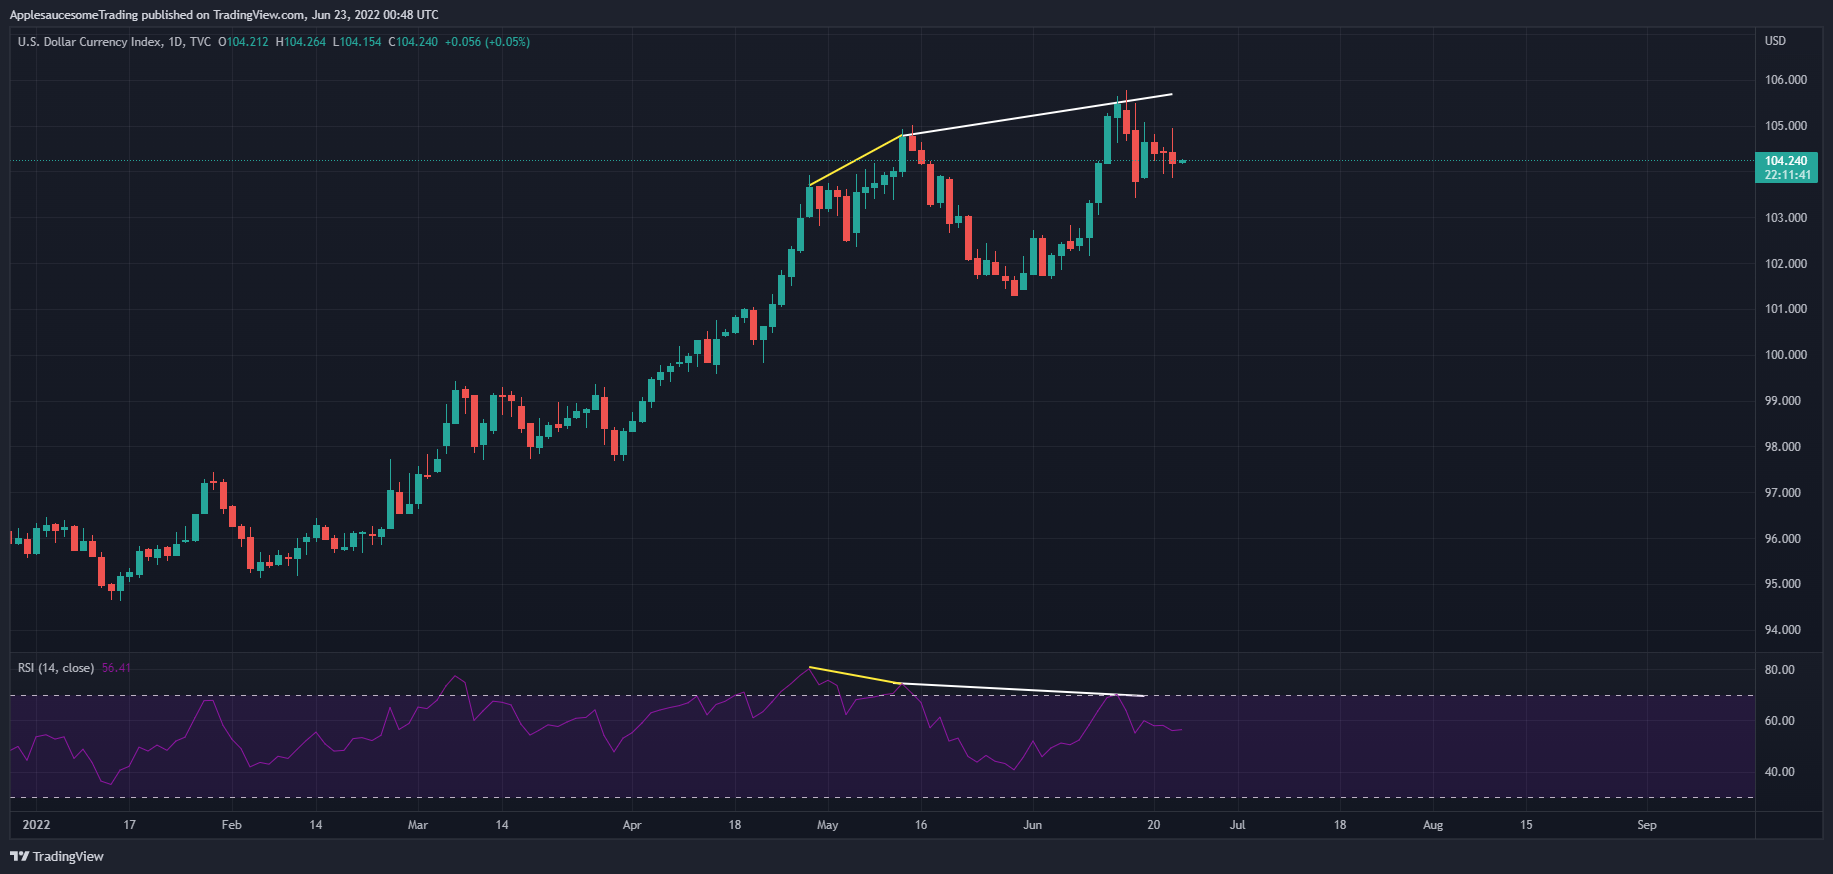
The DYX went on to make another new high but continued bullish divergence. The strength of the dollar continues to gain but there's strong macro signals that there might be opportunity for some risk-on investments.
S&P
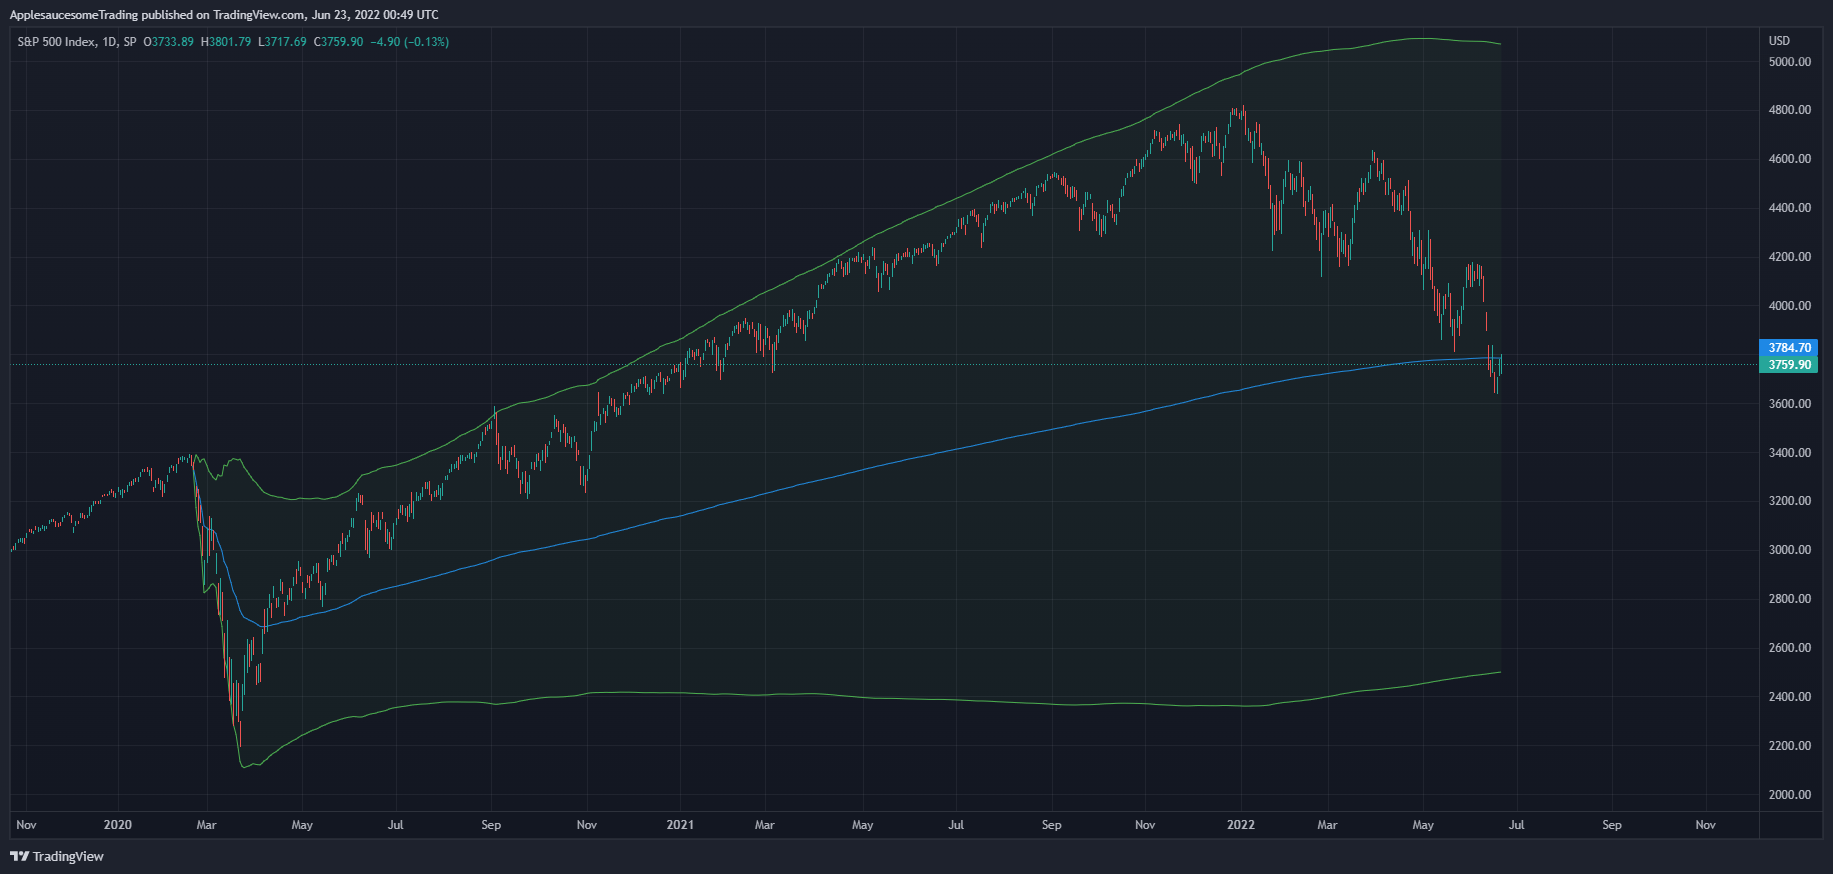
The S&P hasn't broken back above the VWAP yet but has made a bearish retest of it. If it doesn't make it back above then I'd say there's a good chance for continued downward momentum. Powell keeps talking about increasing interest rates even at the risk of a recession. I think he's hoping the market can cool itself off without him having to further add basis points to the interest rate.
BTC
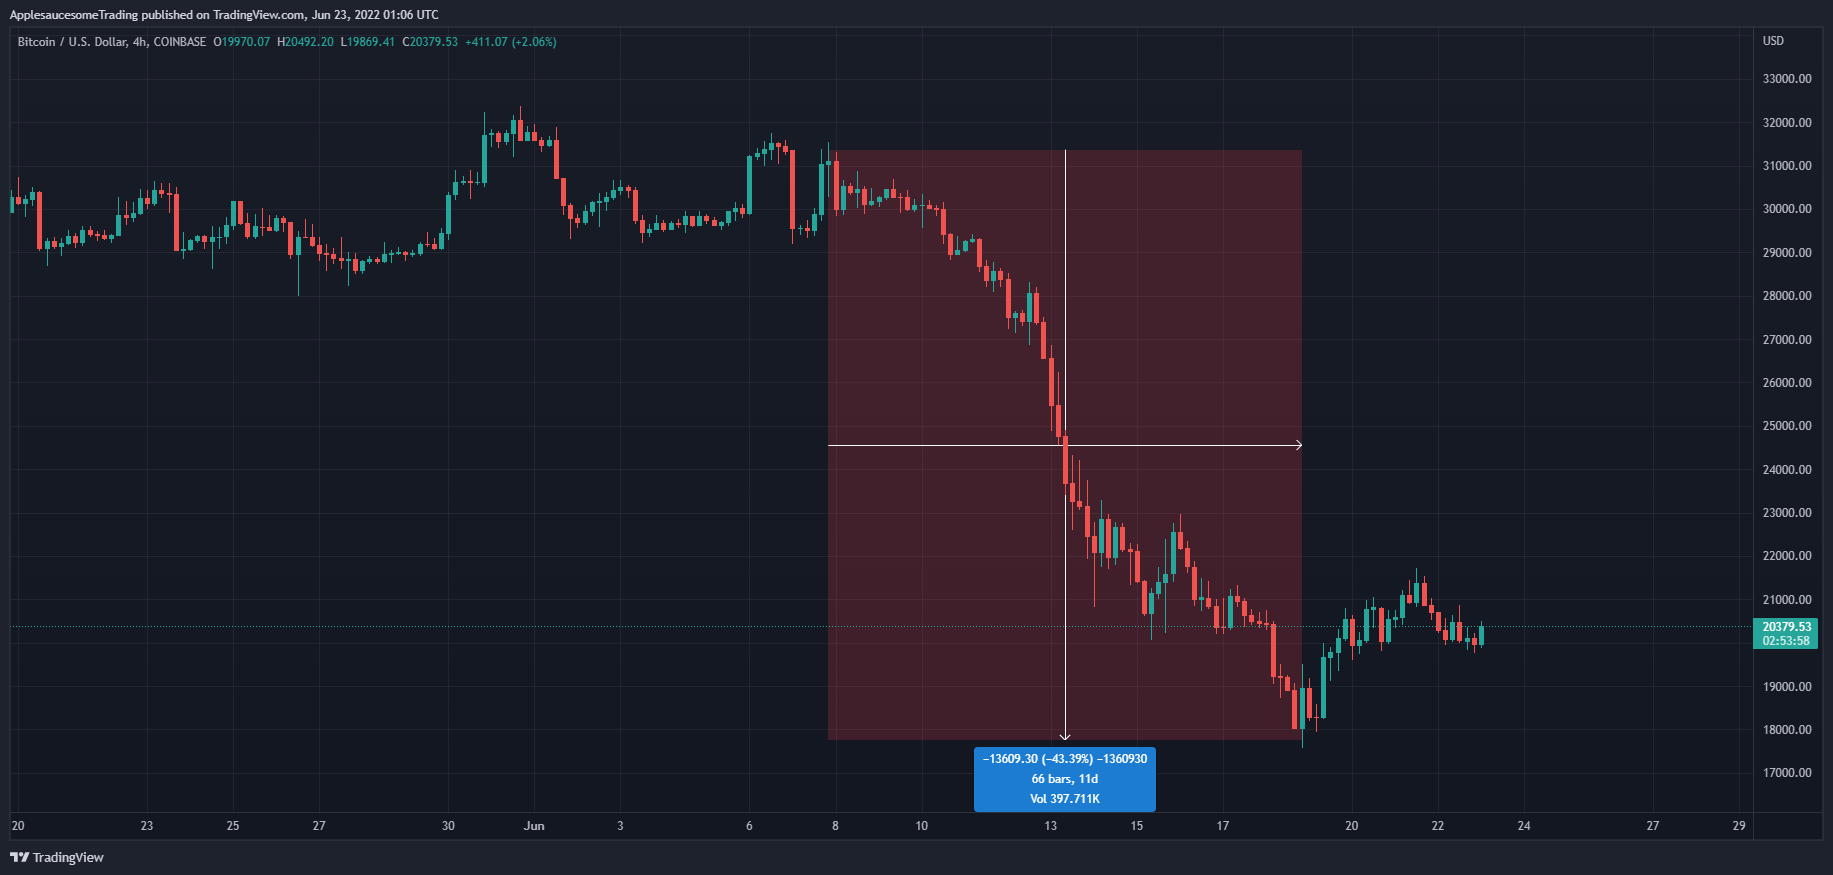
We saw an incredibly bloody capitulation dump the last week. Broke straight through 20k down to $17,600. As of right now we've recovered 20k but will we hold it? In my opinion, I think so.
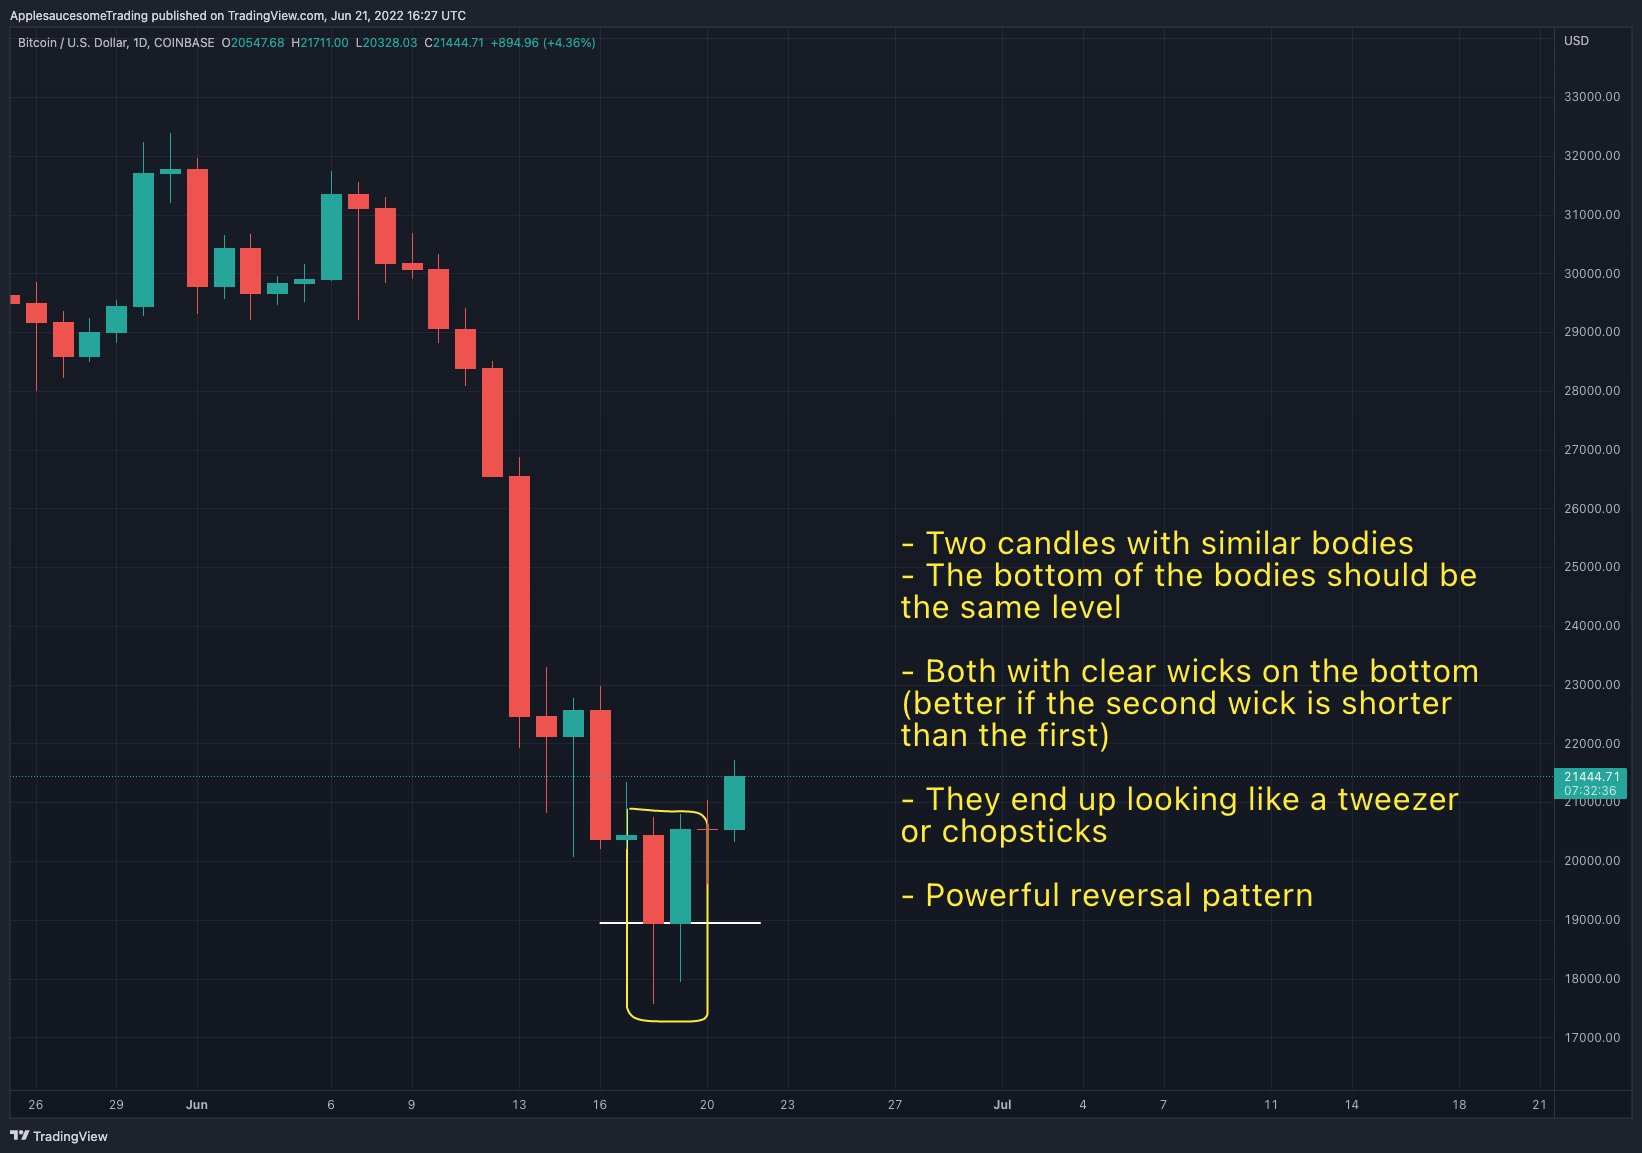
Bitcoin just locked in a textbook tweezer bottom on the daily. In all the charts I've seen tweezer tops/bottoms are some of the strongest patterns I've seen and this one looks beautiful.
DCR
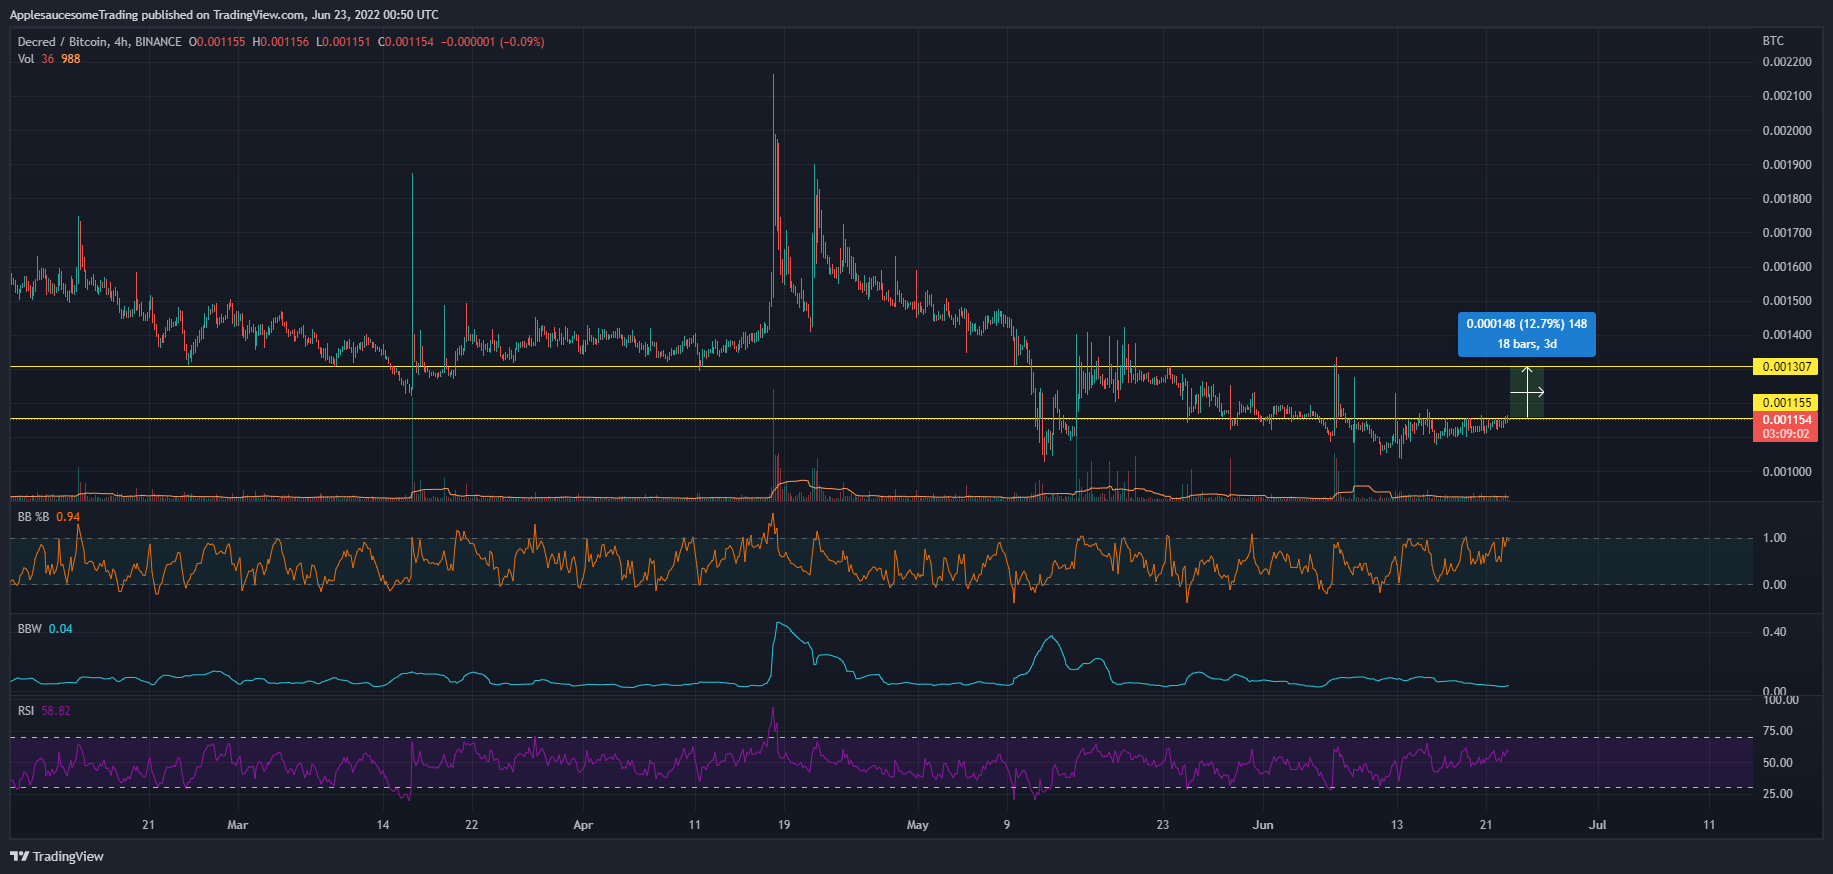
Decred is still stepping in line with Bitcoin but it's actually outperforming it on this dump. It looks like it wants to come back up to test 0.0013. If it can break above that range then 0.0017 is within reach. This price action is very surprising because normally altcoins continue to underperform vs BTC. This time around most alts outperformed BTC. Feels like all the sellers who were going to sell really left the building and only the buyers of last resort were left and they held the line.
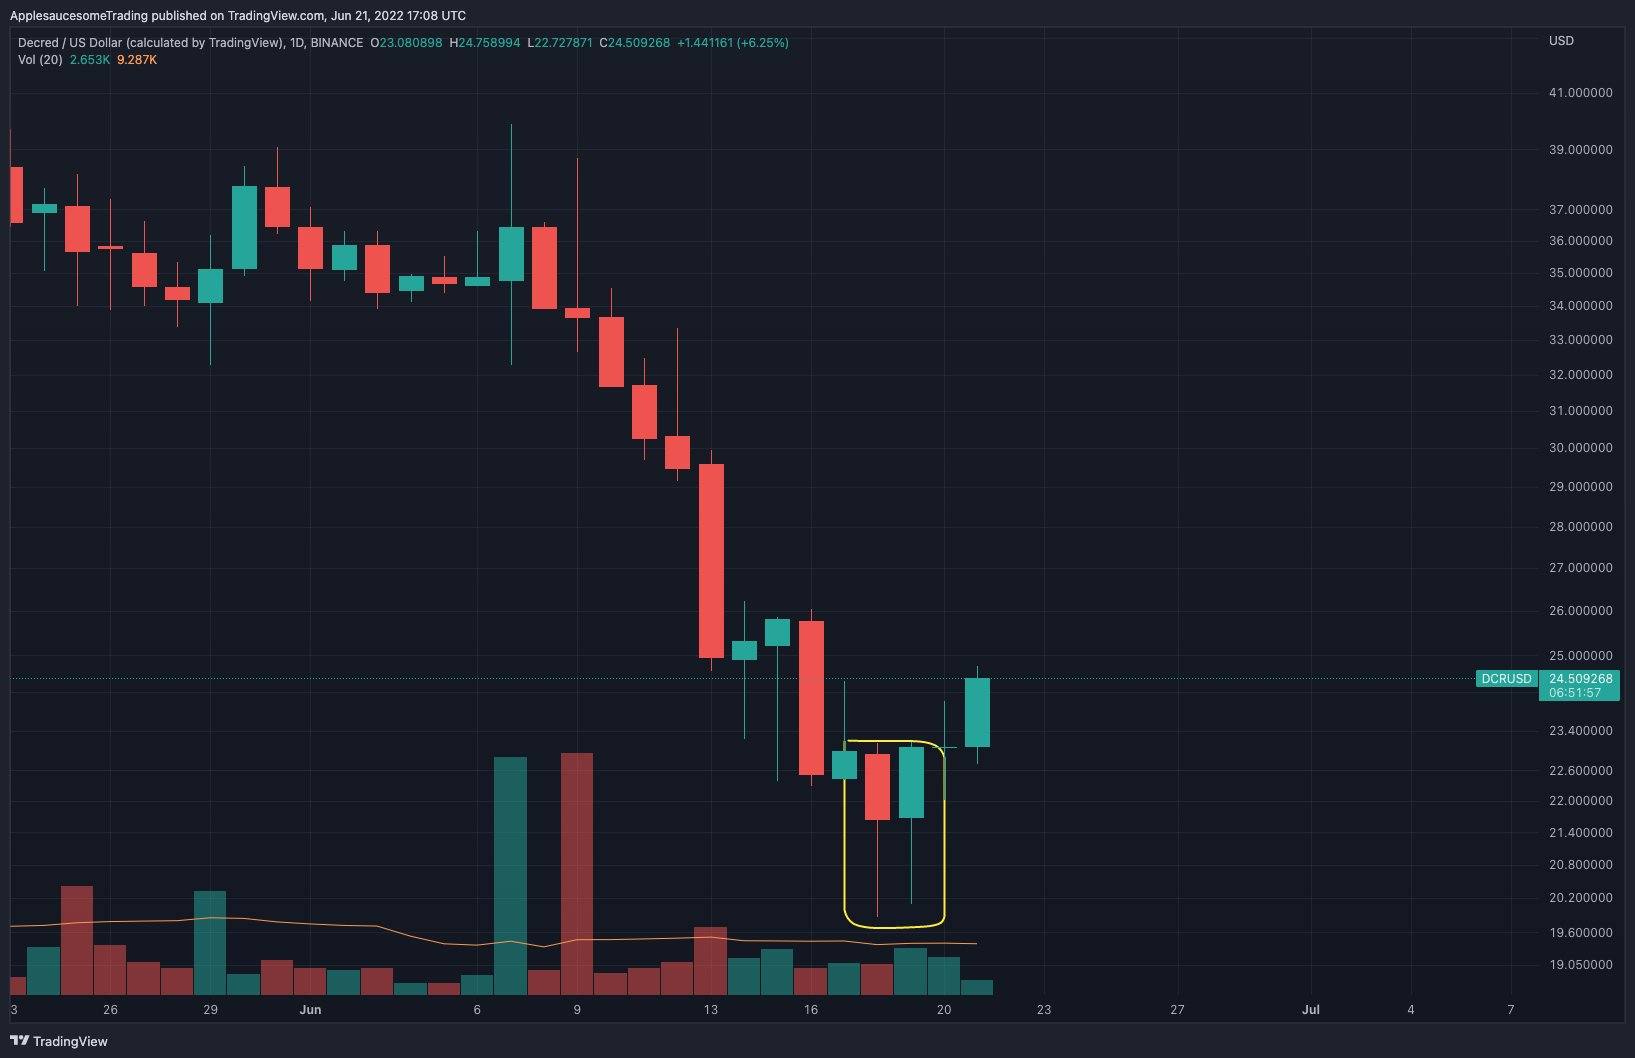
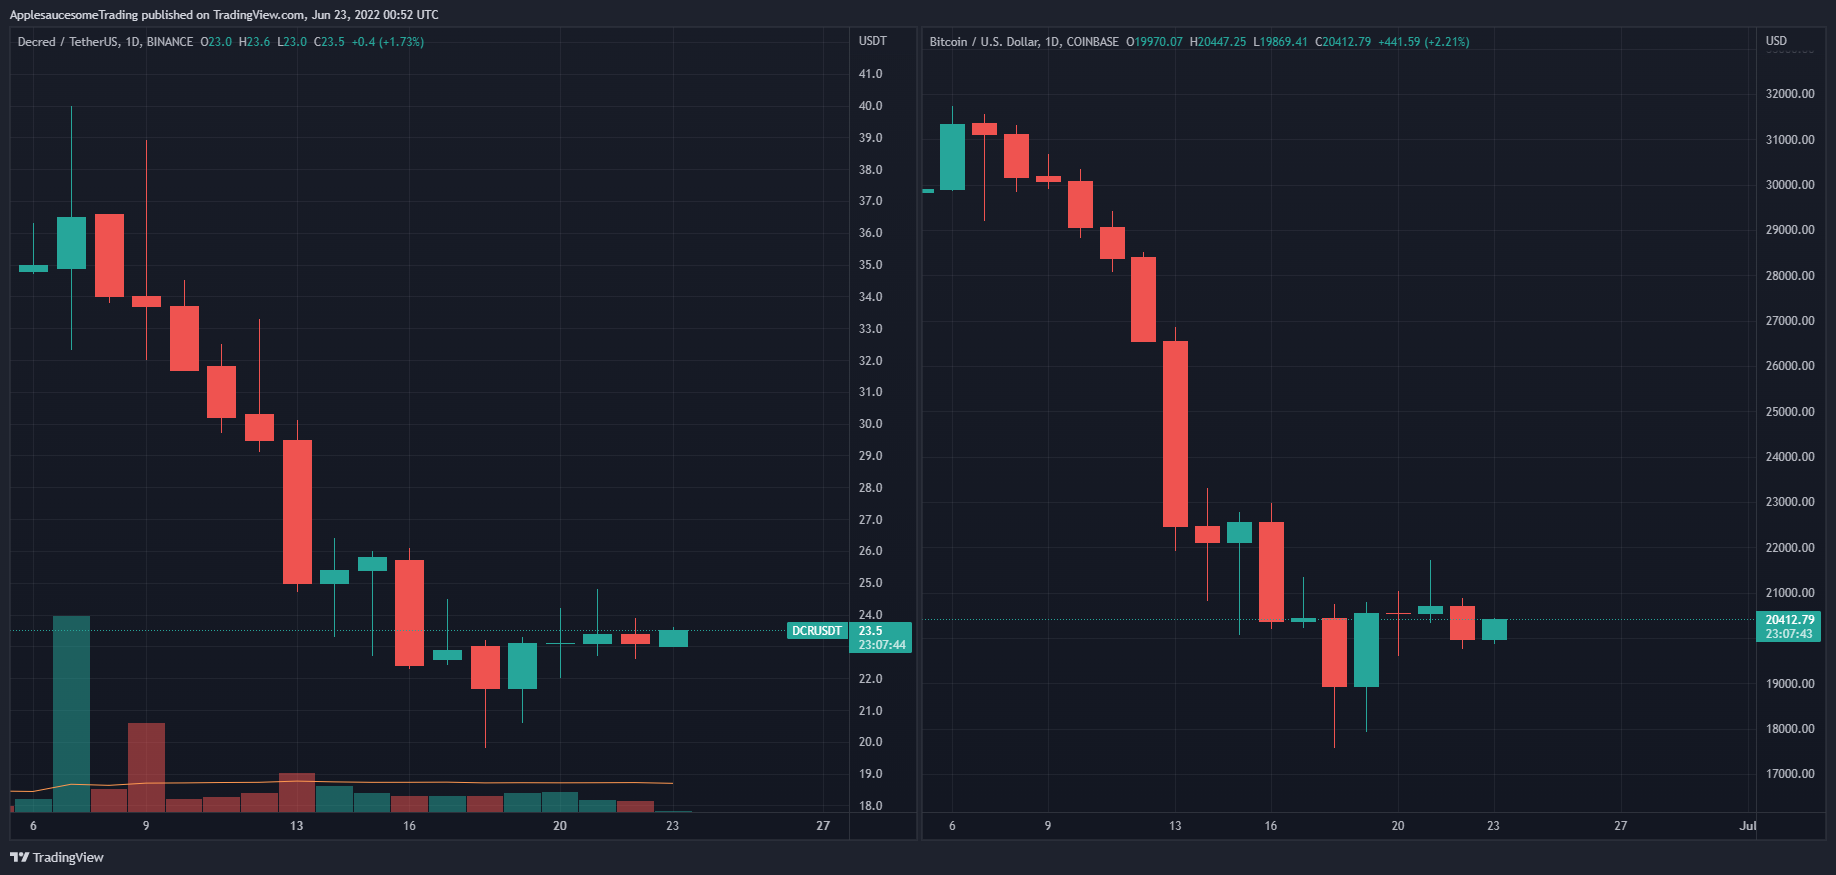
Here's an image of how Decred's USD pairing fared. You can actually see it's extremely similar to Bitcoin, it even outperformed it. If Bitcoin recovers well then I think Decred could outperform it in the recovery rally.
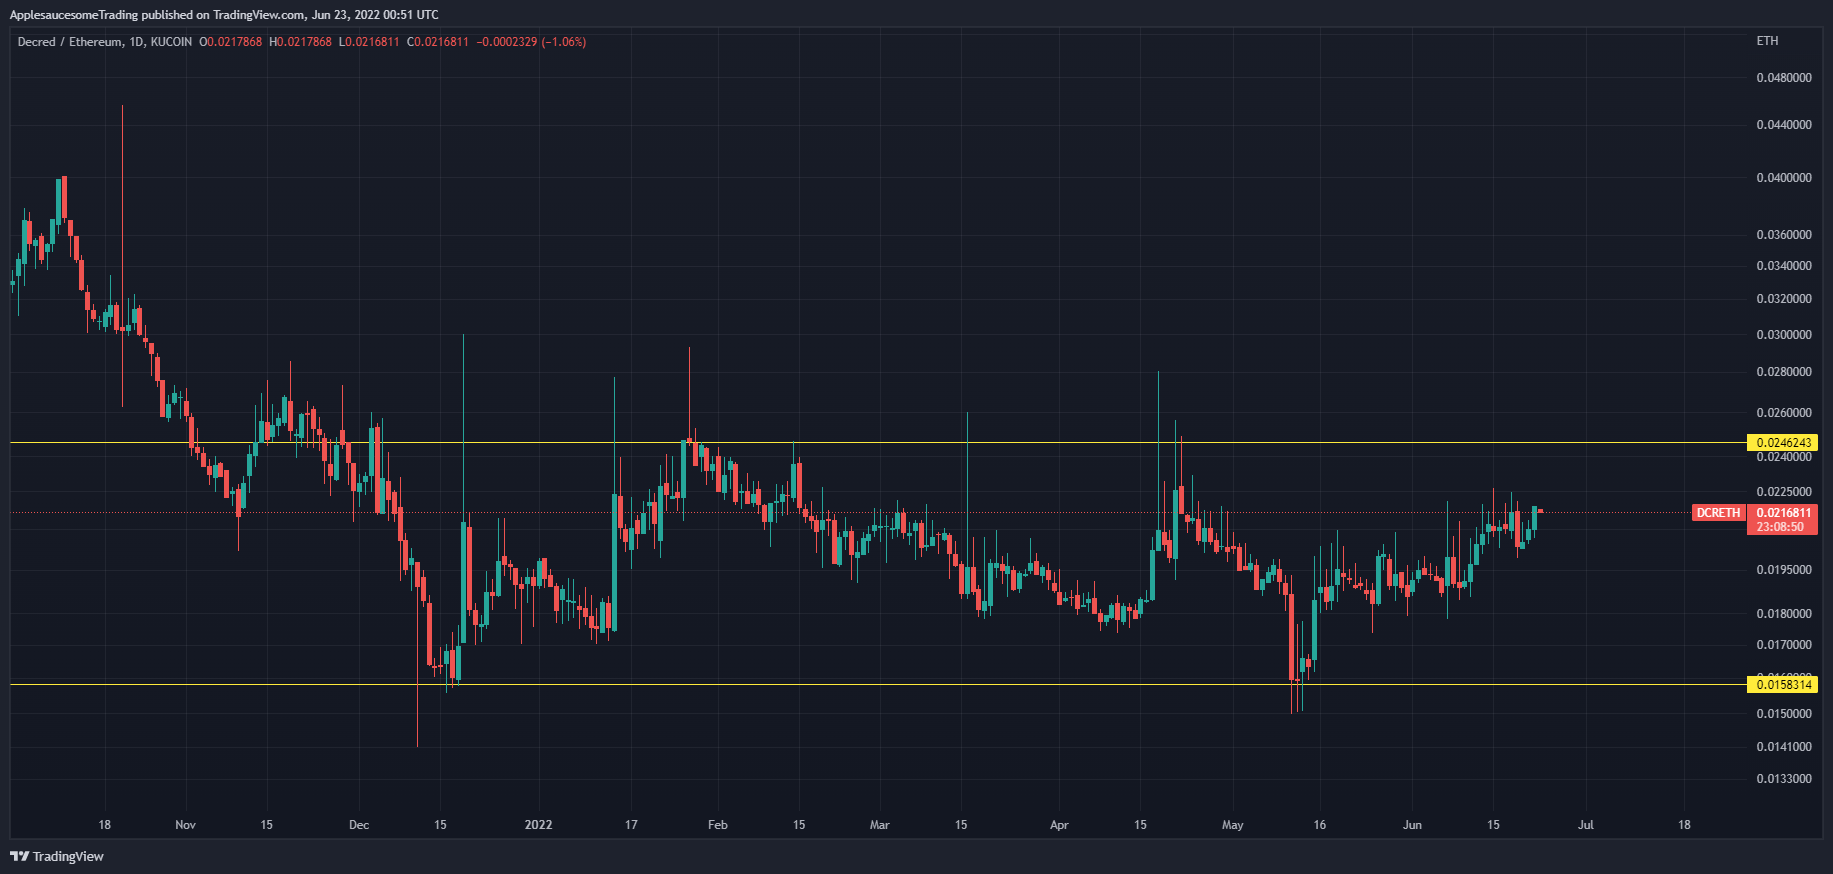
One last chart I wanted to bring up is one that I've been watching for a while now. Decred's ETH pairing. It's been in a ~230 day accumulation trading range. I wouldn't try to trade this pairing but I think it's a very valuable macro indicator that Decred has a lot of built up strength to run extra hard in the next bull run.
Conclusion
The reversal candles look perfect, the bears are calling for another 50% drop to 10k. Bears keep moving their goal posts lower and lower as the greedy euphoria runs strong. 3AC was liquidated. CEL and LUNA got giga-rekt. This has all the signs of market bottoms. We won't know if this was the bottom or if it was just halftime until it's far too late for bears or bulls. (But I'm calling the bottom here)


Comments ()