

Blockchain governance - Part 6
After December 2017 the cryptoasset markets sustained a severe devaluation in face of fiat currencies. Because cryptoassets have different characteristics (affinity demand, scarcity, issuance rules, governance model, hashpower security, technology, development activity and expectations)
By Marcelo Martins - December 31, 2020
Part 6: Testing governance hypotheses Permalink
After December 2017 the cryptoasset markets sustained a severe devaluation in face of fiat currencies. Because cryptoassets have different characteristics (affinity demand, scarcity, issuance rules, governance model, hashpower security, technology, development activity and expectations), the demand curve is different on each case.
A few hypotheses related to Decred Project governance could be tested, like if this bear market could be related to a possible decrease in liquidity of Decred, assuming that holders do not want to sell expecting a bull market while making a passive income from PoS mining, and also, if this price variance could be related to an impact in project’s governance.
The period of time investigated in this section comprises the launch of Decred network on 08 Feb 2016, where the genesis block (name given to the first block) was mined, and 10 Feb 2020, 4 years after the first exchange rate in USD available in Yahoo Finance1. Feb 2020 also avoids significant market impacts that may be related to Covid-19 pandemic2. The Figures and Tables in this section show correlation of data, which does not imply causality. The data was extracted from dcrdata, the Decred own block explorer, from Yahoo! Finance and Blockchain.com website and is available at Decred Governance Data Analysis Github code repository3, along with the R and SQL scripts used to extract and process the data.
Table 16 shows the first assessments made before testing the hypotheses. The average block per day is important for the network to keep the pace in terms of coin issuance and transaction processing while the average daily ticket pool size shows if the ticket pricing algorithm is working as expected, making the tickets more expensive when demand is high and lowering the price when demand drops. Having the observed values close to the expected ones show that the blockchain is working as defined by the consensus rules. These numbers will be used in the coming assessments.
| FROM 08 FEB 2016 TO 10 FEB 2020 | EXPECTED | OBSERVED |
|---|---|---|
| Average block per day | 288 | 288.5479 |
| Average daily ticket pool size | 40 960 | 41 257.3012 |
Table 16 – Decred blockchain expected and observed results
Source: own elaboration
Hypothesis 1: Decred staked percentage is related to coin issuance Permalink
The staked percentage correspond to the amount of coins locked up in tickets. Figure 5 and Table 17 show a strong correlation between coin issuance and staked percentage, indicating that even though more coins are issued, stakeholders keep buying tickets, which drives up ticket price, and then participate in the governance process being financially rewarded for it.
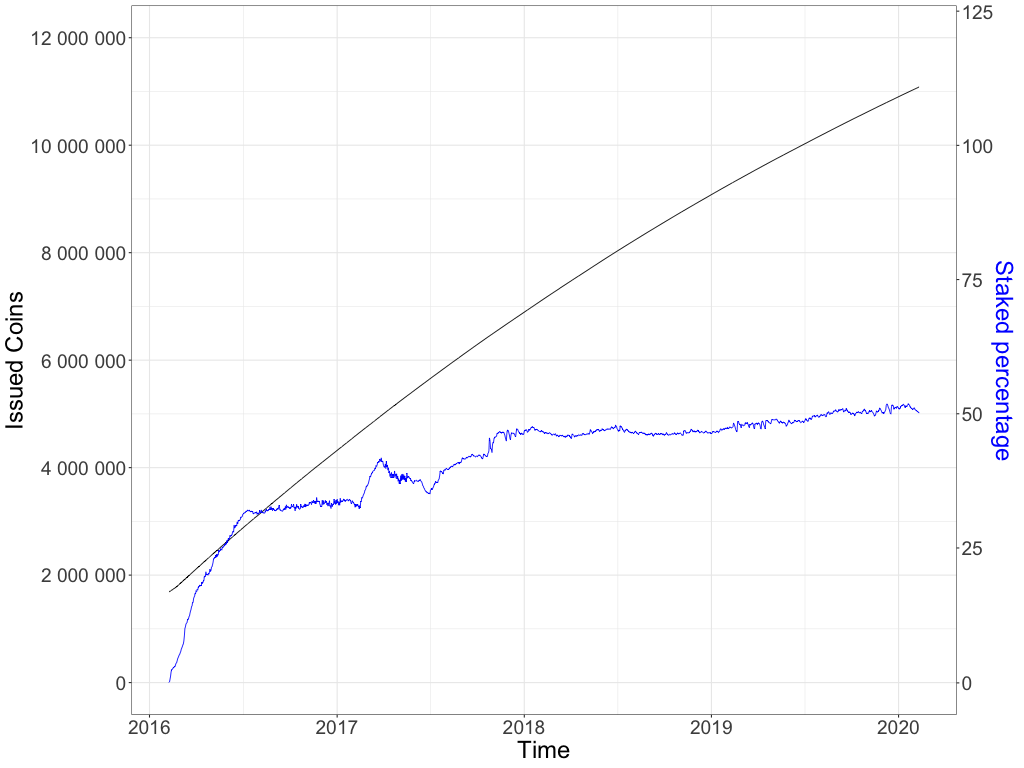
Figure 5 – Issued Decred coins and staked percentage
Source: own elaboration
| SELECTED SAMPLE FROM | ALL TIME | > 10 FEB 2017 | |
|---|---|---|---|
| N | 1464 | 1096 | |
| Pearson’s Correlation | 0.8994 | 0.9045 | |
| Significance test | p-value | < 2.2e-16 | < 2.2e-16 |
Table 17 – Correlation between issued Decred coins and staked percentage
Source: own elaboration
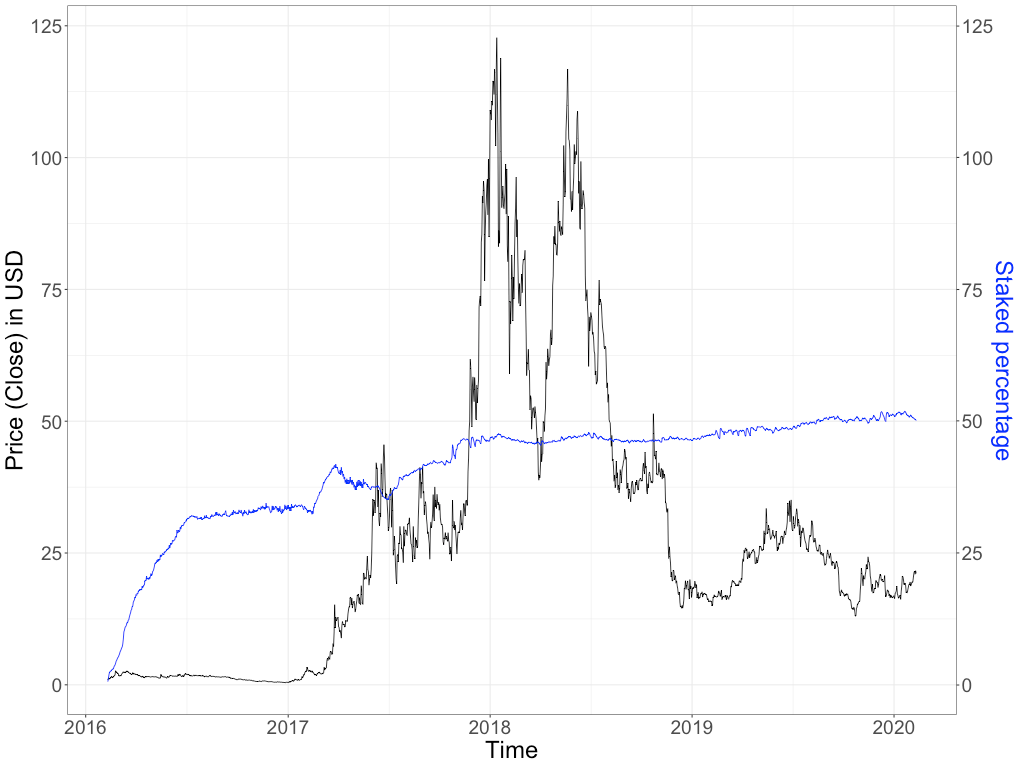
Hypothesis 2: Decred staked percentage is not related to price variance Permalink
Because stakeholders get a reward from the governance process, and because the cryptocurrency market as a whole suffered a severe devaluation in the end of 2017, it is possible that investors that bought Decred when the price was higher now have an incentive to buy tickets and receive a reward while wait for the price to go back up, possibly.
Figure 6 and Table 18 show Decred price in USD and the staked percentage of issued Decred coins. One year after the project was launched, on 10 Feb 2017, 33% of all issued coins were locked up in tickets and this number increased to 50% on 10 Feb 2020. In summary, i) additional coins are issued every day, ii) investors keep showing long-term interest in the project, locking up their coins for up to 143 days to get a reward, and iii) this reward goes down as time goes by, because the reward drops by circa 1% every 21.33 days, as shown in Figure 3 in Part 4 - Decred Project. On the other hand, the slight increase in the staked percentage between Feb 2017 and Feb 2020 (period selected due to the curve shown on Figure 6) does not explain the price variation during the same period. Additional questions should consider if i) price could increase in case of reduced offer of Decred in the market or ii) price could decrease if the market understands that there is not enough Decred liquidity to be regularly used as currency or iii) staked percentage could increase or decrease if the price decreases or increases, respectively, because stakeholders might want to take a profit if the price increases, or stake more if the price decreases and sell later when/if the price rebounds.
Figure 6 – Decred price and staked percentage (PoS security)
Source: own elaboration
| SELECTED SAMPLE FROM | > 10 FEB 2016 | > 10 FEB 2017 | |
|---|---|---|---|
| N | 1462 | 1096 | |
| Pearson’s Correlation | 0.4970 | 0.123 | |
| Significance test | p-value | 0.0176 | 1 |
Table 18 – Correlation between Decred price and staked percentage
Source: own elaboration
Figure 7 and Table 19 explore the correlation between the percentage of staked coins and the return in USD per ticket, in average, to investigate a relation between a possible drop in return and the incentives the investors have to keep staking.
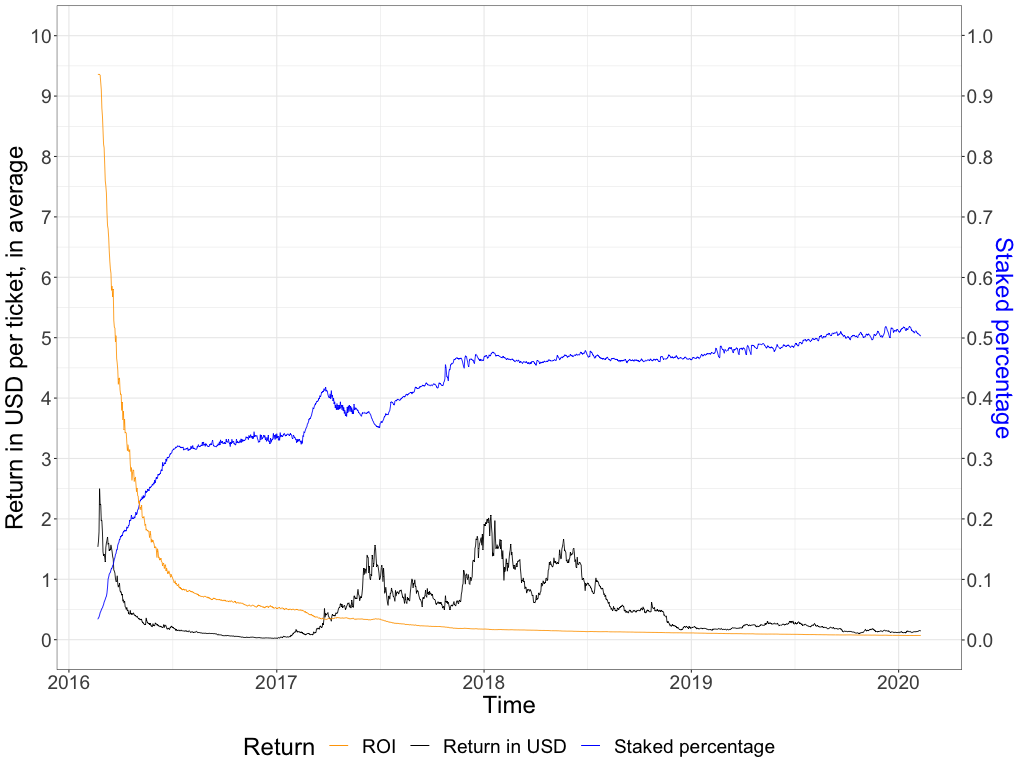
Figure 7 – Return in USD per ticket and staked percentage (PoS security)
Source: own elaboration
Against the expectations, the return in USD shows a weak inverse correlation with the staked percentage, indicating that even the returns dropping the investors keep staking and participating in the governance process. The orange line represents the Return on Investment (ROI) and it measures the return in DCR for each ticket bought, considering the ticket price which is adjusted by the consensus rules to keep an average of 40 960 tickets in the ticket pool. The corresponding scale is in the right axis and starts in 21 Feb 2016 with a ROI of 93.59% and ends in 10 Feb 2020 with 0.69%. It means that in 21 Feb 2016, when the ticket price was DCR 2.00, the investors received a return of 93.59% (or DCR 1.8717) for each ticket bought, every 20 days, in average.
| SELECTED SAMPLE FROM | > 21 FEB 2016 | > 10 FEB 2017 | |
|---|---|---|---|
| N | 1450 | 1083 | |
| Pearson’s Correlation | -0.0711 | -0.3177 | |
| Significance test | p-value | 1 | 1 |
Table 19 – Correlation between Return in USD per ticket and staked percentage
Source: own elaboration
Hypothesis 3: PoW security is not related to price Permalink
Although there is not a unique method for cryptocurrency valuation, it is well-known in crypto financial markets that cryptocurrency value comes from its utility (or the utility investors derive from it) as in traditional money, as explained in Part 2 - The tech behind digital money, not from its cost. As shown in Part 5 - Assessing blockchain governance, subsection ‘Security increases opportunity costs’, an increase in security (or utility) could increase the perceived value and drive its price up. Investors might also turn off mining devices if cryptocurrency price is not enough to cover the costs of running them to provide security to the network, driving its price down. Figure 8 and Table 20 show weak correlation between this assumed relation, price and network difficulty for Decred, for selected samples from 2019 onwards. There is no correlation between such variables when the samples include the whole history or until 31 Dec 2018.
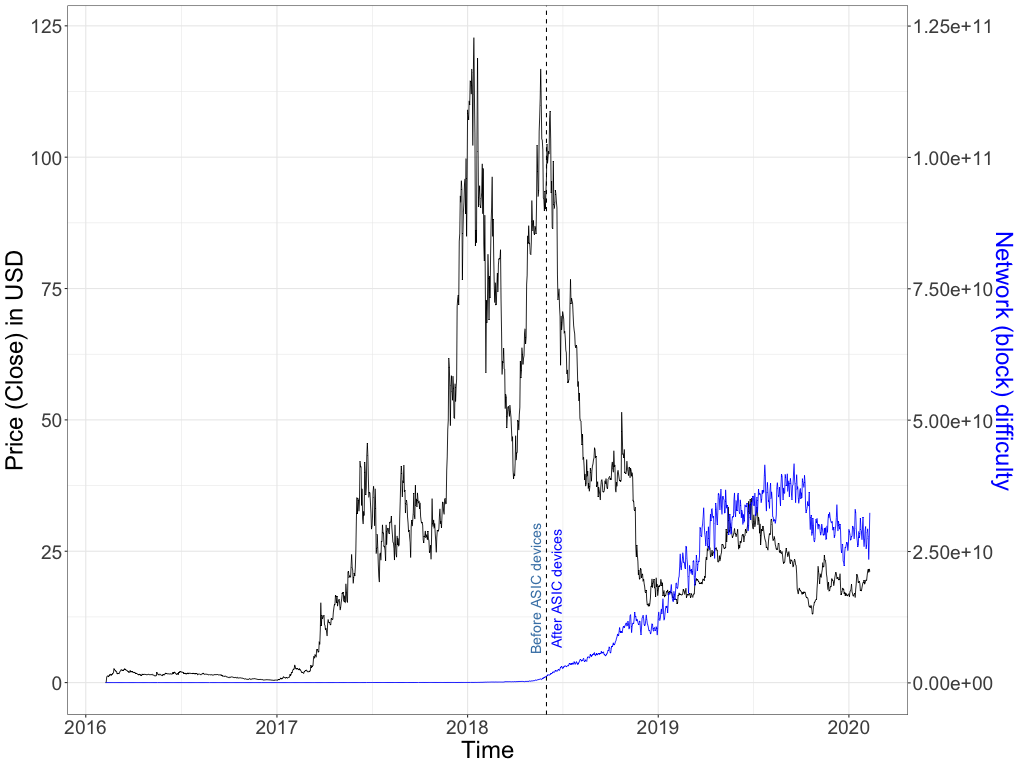
Figure 8 – Decred price and network difficulty (PoW security)
Source: own elaboration
| SELECTED SAMPLE FROM | ALL TIME | < 30 DEZ 2018 | > 01 JAN 2019 | |
|---|---|---|---|---|
| N | 1464 | 1058 | 406 | |
| Pearson’s Correlation | -0.0939 | 0.1138 | 0.5308 | |
| Significance test | p-value | < 2.2e-16 | < 2.2e-16 | 0.0102 |
Table 20 – Correlation between Decred price and network difficulty
Source: own elaboration
Figure 9 and Table 21 also show a weak correlation between price and network difficulty for Bitcoin, no matter the period selected. The third Bitcoin ‘halving’ event, name given to the programmed periodic change that reduces in half the coin issuance, do not seem to have caused any impact, according to Figure 9, although at that time, the cryptocurrencies were unknown to most of the people and the market was not developed as it is today.
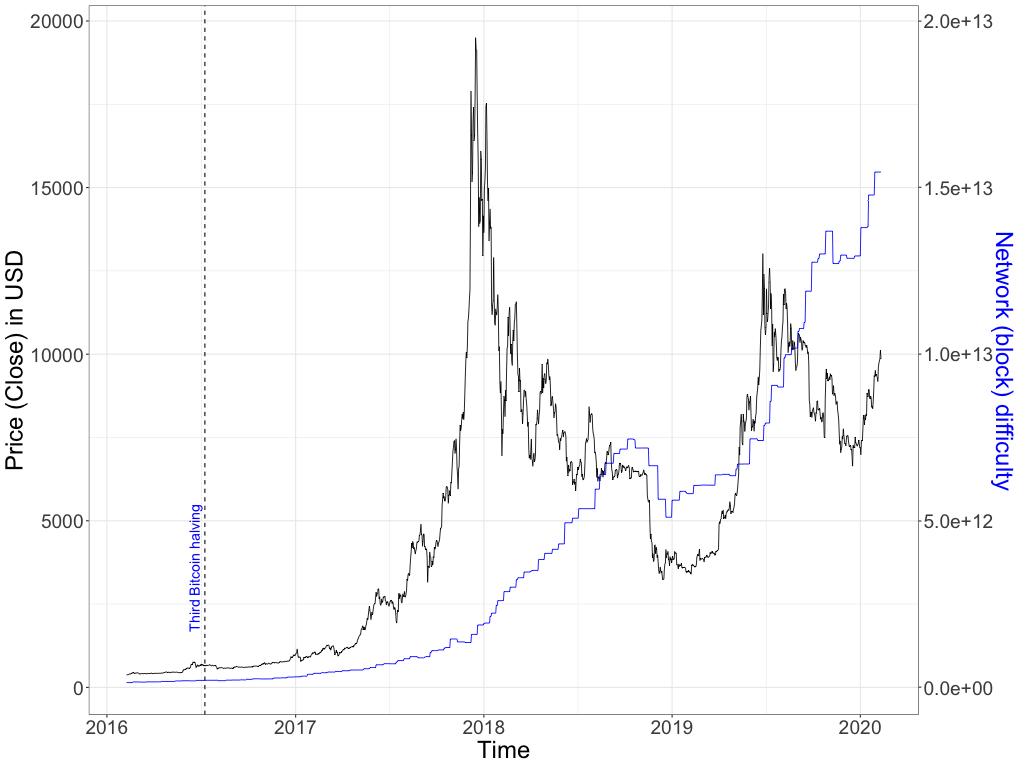
Figure 9 – Bitcoin price and network difficulty (PoW security)
Source: own elaboration
| SELECTED SAMPLE FROM | ALL TIME | < 30 DEZ 2018 | > 01 JAN 2019 | |
|---|---|---|---|---|
| N | 1464 | 1058 | 406 | |
| Pearson’s Correlation | 0.5924 | 0.5376 | 0.5486 | |
| Significance test | p-value | < 2.2e-16 | < 2.2e-16 | < 2.2e-16 |
Table 21 – Correlation between Bitcoin price and block mining difficulty
Source: own elaboration
Hypothesis 4: Privacy participation is not related to Decred price variance Permalink
In the cryptocurrency market, just like regular enterprise valuation, new features (or contracts) may be related to an increase in price, at least for a very short time, maybe only on release day. A decrease in price is also possible, with some investors selling their positions once the event happens, because it was already ‘priced’ before the event. Another explanation for a decrease in price would be a lack in governance transparency added by the privacy feature, because it is not possible to track founders’ expenditure anymore and they might be heavily invested (staked) causing imbalances to the decision-making process, taking advantage on their initial position size (pre-mine). Figure 10 and Table 22 show a weak inverse correlation between Decred price (close) in USD and the release of the privacy feature.
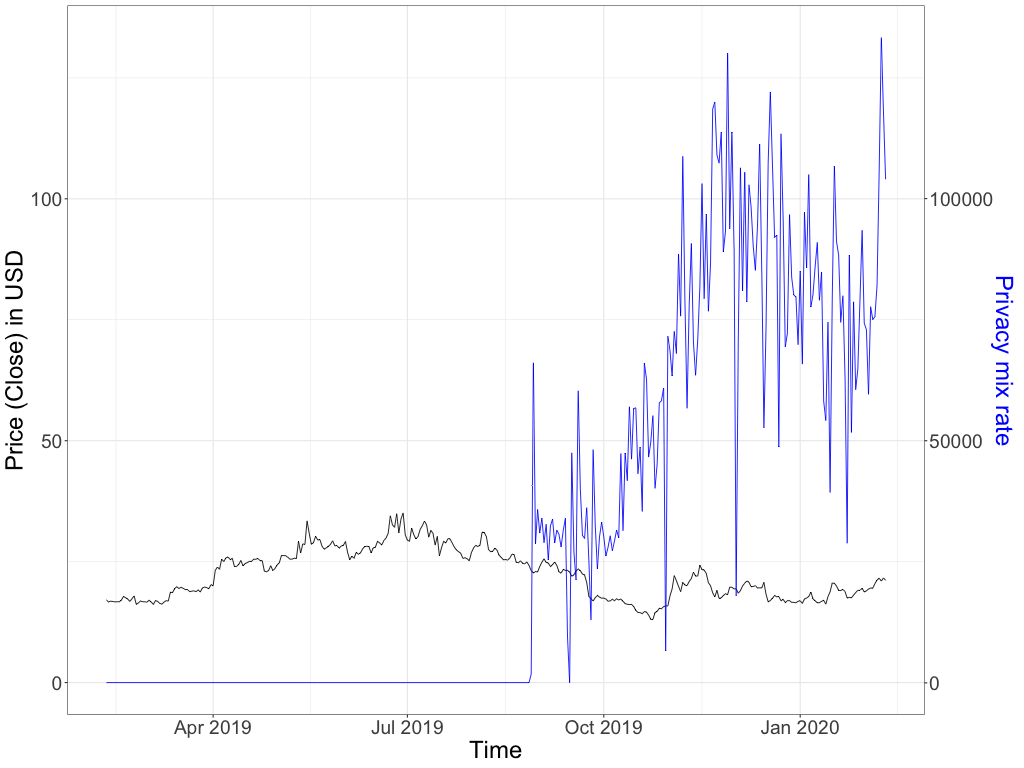
Figure 10 – Decred price variance and coins in private transactions
Source: own elaboration
| N | 366 | |
|---|---|---|
| Pearson’s Correlation | -0.5286 | |
| Significance test | p-value | < 2.2e-16 |
Table 22 – Correlation between Decred price (close) and privacy mix rate
Source: own elaboration
Hypothesis 5: Observed coin issuance is related to expected coin issuance Permalink
The introduction of Part 2 - The tech behind the digital money and its subsection ‘Incentives and inflation’ detailed the properties of money, like scarcity, and argued that ‘good and trustworthy coins’ must be issued in a predictable manner and according to its value. Consensus rules in the protocol, kept in place by good governance, are responsible for the issuance of new coins, which are the incentive for miners to provide security to the blockchain and to stake coins in PoS tickets. Figure 11 and Table 23 show a perfect correlation between the expected coin issuance (dashed blue curve) defined in Decred blockchain consensus rules and the observed coin issuance (continuous black curve) from 08 Feb 2016 and 10 Feb 2020.
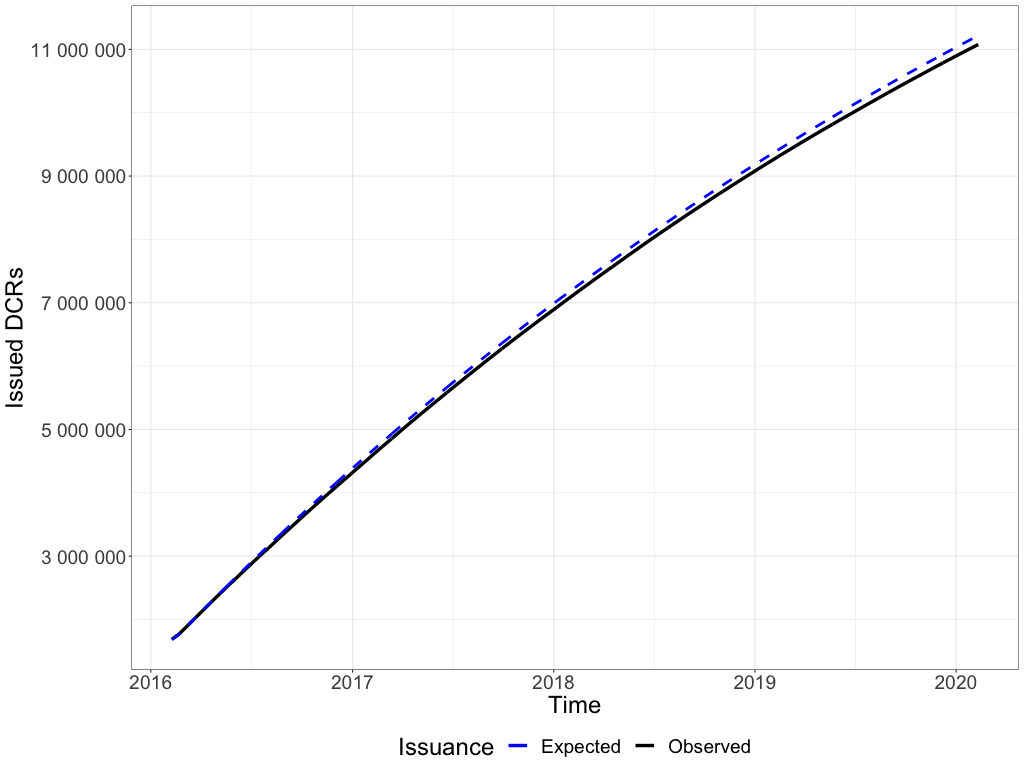
Figure 11 – Expected and observed Decred coin issuance
Source: own elaboration
| N | 1464 | |
|---|---|---|
| Pearson’s Correlation | 1 | |
| Significance test | p-value | < 2.2e-16 |
Table 23 – Correlation between expected and observed Decred coin issuance
Source: own elaboration
The difference between expected and observed coin issuance can be explained by Table 24, that shows the number of blocks with only 3 and 4 ticket votes. The blockchain protocol defines that a ticket drawn in one block must sign a transaction validating the next block, thus adding security to the network. Besides that, these stakeholders can vote in the on-chain and off-chain proposals and for such are rewarded with 30% (6% for each of 5 tickets/votes per block) of coin issuance for that block. If the wallet (name given to the software that manages private keys that sign transactions) is offline when the ticket is drawn, it will not sign the transaction and will not be rewarded with new coins. This also reduces the PoW reward, which reaches 100% only when 5 voting tickets are mined.
| FROM 08 FEB 2016 TO 10 FEB 2020 | COUNT | PERCENTAGE |
|---|---|---|
| Blocks with 0 voting tickets | 4 096 | 0.0097 |
| Blocks with only 3 voting tickets | 5 526 | 0.0131 |
| Blocks with only 4 voting tickets | 21 881 | 0.0518 |
| Blocks with all 5 voting tickets | 391 045 | 0.9254 |
Table 24 – Decred ticket voters per block
Source: own elaboration
Hypothesis 6: Tickets are drawn as expected in the official documentation Permalink
As explained before, predictability and scarcity play their role in the process of building a trustworthy coin. To keep stakeholders interested in the staking process, fundamental to governance, the voting chance must meet the expectations and the financial reward must be paid according to the consensus rules. The official Decred documentation4 displays a chart with the probability of a ticket voting by day. Table 25 shows these expected values for ticket vote chance, as documented by the project, and the observed values from 08 Feb 2016 to 10 Feb 2020. Table 26 shows a very strong correlation between those values, which indicates that ticket vote chances, and investors rewards, happen in practice as described in theory. Figure 12 below shows the cumulative vote chance curve.
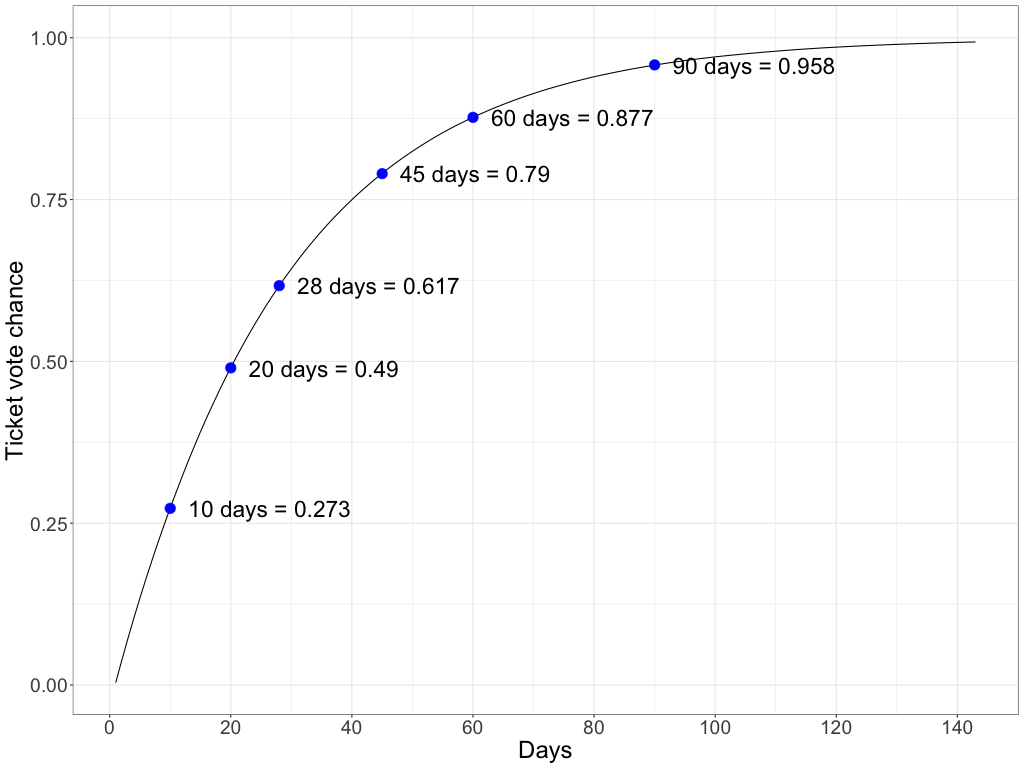
Figure 12 – Observed cumulative frequency of Decred ticket vote chance
Source: own elaboration
| FROM 08 FEB 2016 TO 10 FEB 2020 | EXPECTED | OBSERVED |
|---|---|---|
| Chance of having the ticket voted in 10 days | 0.296 | 0.273 |
| Chance of having the ticket voted in 20 days | 0.505 | 0.490 |
| Chance of having the ticket voted in 28 days | 0.626 | 0.617 |
| Chance of having the ticket voted in 45 days | 0.794 | 0.790 |
| Chance of having the ticket voted in 60 days | 0.879 | 0.877 |
| Chance of having the ticket voted in 90 days | 0.958 | 0.958 |
| Chance of having the ticket expired (after 143 days) | 0.005 | 0.007 |
Table 25 – Expected and observed cumulative Decred ticket vote chance
Source: own elaboration
| N | 7 | |
|---|---|---|
| Pearson’s Correlation | 0.9998 | |
| Significance test | p-value | < 2.2e-16 |
Table 26 – Correlation between expected and observed Decred ticket vote chance
Source: own elaboration
Hypothesis 7: Decred price variance is related to Bitcoin price variance Permalink
For the past years, empirical knowledge established that Bitcoin and the alternative currencies tend to walk together for some periods of the year and go opposite ways on others. Figure 13 and Table 27 show that this was true for Decred and Bitcoin until 01 Jun 2018, when Decred ASIC devices hit the market, which may or may not be a significant event for this comparison. After 01 June 2018 and until 10 Feb 2020, Decred and Bitcoin exchange rates to USD are uncorrelated. As shown in Figure 13, Bitcoin price movements do not seem to influence Decred price movements as it did before that date, when they were strongly correlated.
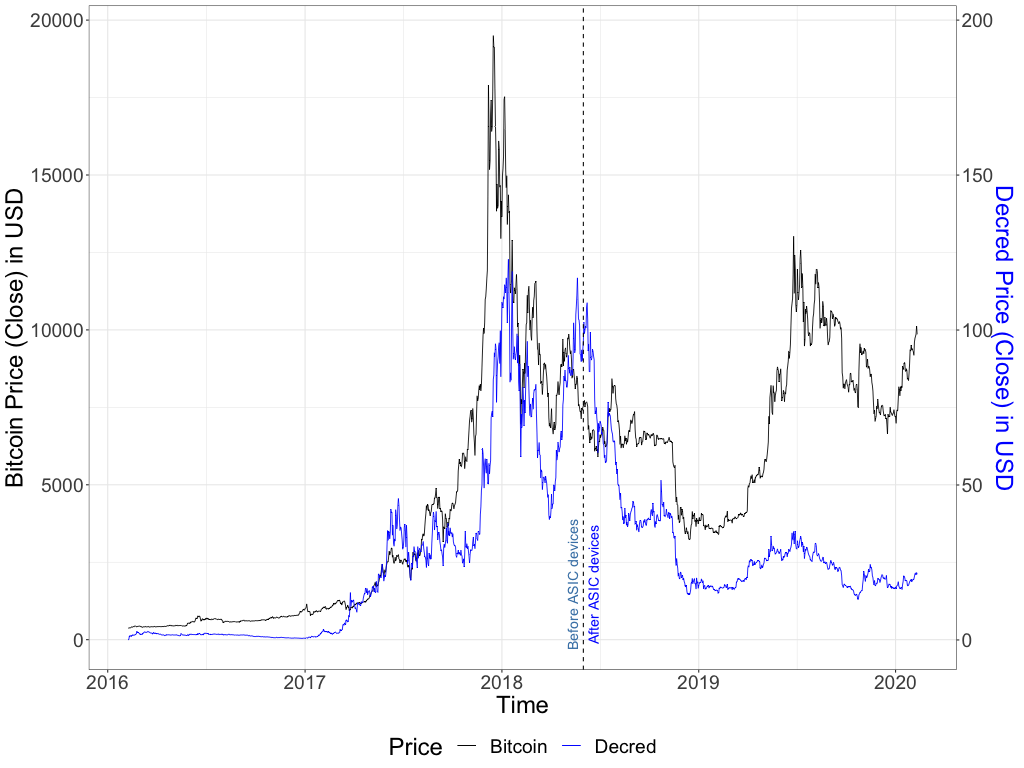
Figure 13 – Decred and Bitcoin prices (close) in USD
Source: own elaboration
| SELECTED SAMPLE FROM | ALL TIME | < 30 MAY 2018 | > 01 JUNE 2018 | |
|---|---|---|---|---|
| N | 1464 | 844 | 620 | |
| Pearson’s Correlation | 0.7233 | 0.9156 | 0.0886 | |
| Significance test | p-value | < 2.2e-16 | < 2.2e-16 | < 2.2e-16 |
Table 27 – Correlation between Decred and Bitcoin prices (close) in USD
Source: own elaboration
When this information is analysed together with Table 20 and Figure 8, the correlation between Decred price and Decred network difficulty, it is possible to notice a relation between the timelines. The data shows that at some point between June 2018 (when Decred ASIC devices hit the market) and Jan 2019, Decred price was not correlated to Bitcoin price anymore, but to Decred network difficulty. One possible explanation for this event is the fixed cost of running the ASIC devices, which makes PoW miners the biggest sellers of coins. Bitcoin and Decred ASIC devices are different because of the one-way hashing algorithm used by the projects. Bitcoin uses SHA-2566 and Decred uses BLAKE-2567.
Hypothesis 8: Decred voting turnout is higher on consensus rules Permalink
Decred stakeholders (PoS) seem to be more interested in long-term decisions, like the ones that change the consensus rules (on-chain governance) than project management and network funding decisions (off-chain governance). Figures 14 and 15 and Table 28 show PoS voting turnout and approvals for 57 off-chain and 5 on-chain governance proposals.
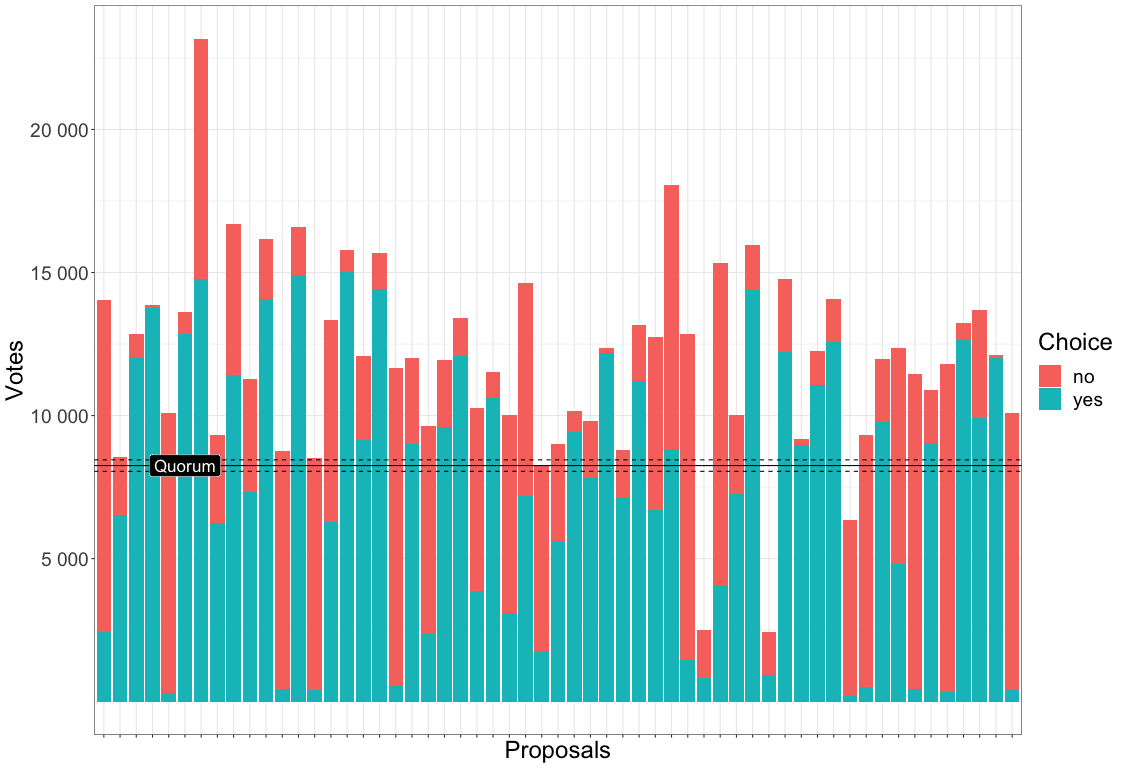
Figure 14 – Votes by proposal in Decred Politeia voting platform (off-chain)
Source: own elaboration
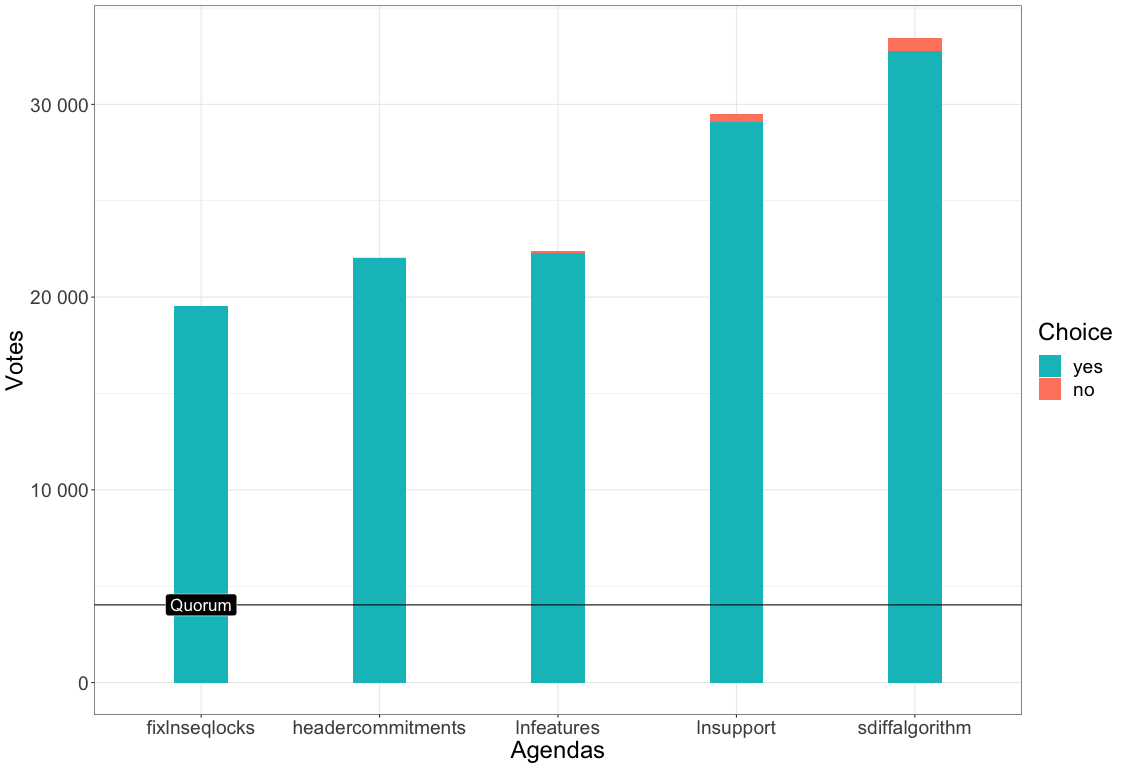
Figure 15 – Votes by proposal to change consensus rules (on-chain)
Source: own elaboration
While Figure 14 shows 3 proposals that did not reach quorum and other 5 that barely made it from a total of 57, Figure 15 shows that all 5 proposals had a higher average turnout and approval rate, which may also be an indicative of the opinion of stakeholders regarding the objectives being financed (off-chain proposals) or the quality of the proposals written by core developers (on-chain proposals) given that average disapproval rates of on-chain proposals were minimal compared to average disapproval rates of off-chain proposals.
The average voting turnout was calculated considering an average of votes ‘yes’ or ‘no’ cast per proposal divided by the average number of live daily pool tickets, shown in Table 28. This next Table also shows the average voting turnout and approval for both voting processes. For on-chain governance, while the approval percentages may seem low when compared to Figure 15 (only 67,99%, in average), the calculations consider the rate of votes ‘yes’ among ‘no’ and abstentions, with this last ‘choice’ deliberately not shown in Figure 15.
| . | OFF-CHAIN GOV. | ON-CHAIN GOV. |
|---|---|---|
| N Proposals | 57 | 5 |
| Average daily ticket pool size | 41 257.3012 | 41 257.3012 |
| Average voting turnout | 0.2894 | 0.6153 |
| Average proposal approval | 0.5965 | 0.6799 |
Table 28 – Observed average of turnout and approval percentage
Source: own elaboration
OLS model and regression tree Permalink
Table 29 shows an Ordinary Least Squares (OLS) model taking into consideration data from 01 Jan 2019 to 10 Feb 2020, where Decred price is the dependent variable. The quality of adjustment is good, as we can observe from R-squared and F-statistics. We may observe that Staked Percentage might have negatively influenced Decred price while Average Hashrate and Coin Issuance have a positive impact. Transaction Count and Transaction Sum seem to have no impact in Decred price. It might be interpreted as a sign that long-term investors must reduce their positions in staking to be able to transact Decred. Hashrate may increase price but may also be a sign that miners are turning off their devices when prices are too low.
Residuals
| MIN | 1Q | MEDIAN | 3Q | MAX |
|---|---|---|---|---|
| -9.6921 | -2.0604 | 0.0554 | 2.2413 | 11.2513 |
Coefficients
| . | COEFFICIENT | STD. ERROR | T VALUE | PR(>|T|) |
|---|---|---|---|---|
| Intercept | 7.758e+01 | 9.471e+00 | 8.191 | 3.53e-15 *** |
| Coin Issuance | 1.598e-03 | 5.555e-04 | 2.877 | 0.00423 ** |
| Average Hashrate | 4.330e-08 | 2.322e-09 | 18.646 | < 2.2e-16 *** |
| Staked Percentage | -1.625e+02 | 1.736e+01 | -9.362 | < 2.2e-16 *** |
| Transaction Count | -3.820e-04 | 4.306e-04 | -0.887 | 0.37557 |
| Transaction Sum | 1.003e-07 | 4.998e-07 | 0.201 | 0.84108 |
Significance: 0 ‘***’ 0.001 ‘**’ 0.01 ‘*’ 0.05 ‘.’ 0.1 ‘’ 1
Residual standard error: 3.654, Degrees of freedom: 400
R-squared: 0.4803, Adjusted R-squared: 0.4738
F-statistic: 73.94 (p-value: < 2.2e-16)
Table 29 – OLS model: Decred Price (USD) as dependent variable
Source: own elaboration
Figure 16 and Table 30 show the relation between price, average hashrate and staked percentage using a regression tree, a machine algorithm built through a process known as binary recursive partitioning, based on an iterative process that splits the data into partitions or branches (Breiman, Friedman, Olshen, & Stone, 1984). Lower prices were observed when the network had lower average hashrates and at the same time hashrates were higher, the staked percentage was diminishing when compared to maximum values. First, the data was divided in 70% training and 30% testing samples. Then, a hyperparameter model with 240 combinations of different values for minimum split of branches, maximum number of leaves and complexity parameter was generated. All models were tested and the values that produced the least amount of cross-validated error were chosen as the optimal model to generate the regression tree. The Mean Absolute Error calculated using the optimal model against the testing sample was 2.6096 and the Root Mean Square Error was 3.4690. Table 31 shows the importance each variable had in the calculations. We may conclude that average hashrate and staked percentage are the most important variables to try to understand price levels. The regression tree was optimised to select the number of tree leaves and levels to reduce the mean absolute error, and considered that coin issuance, transaction count and transaction sum were irrelevant to predict price. The market showed some correlation regarding low hashrates and low prices and also high hashrates and staked percentage below 50%, and these patterns accounted for almost two thirds of observed prices between 01 Jan 2019 and 10 Feb 2020.
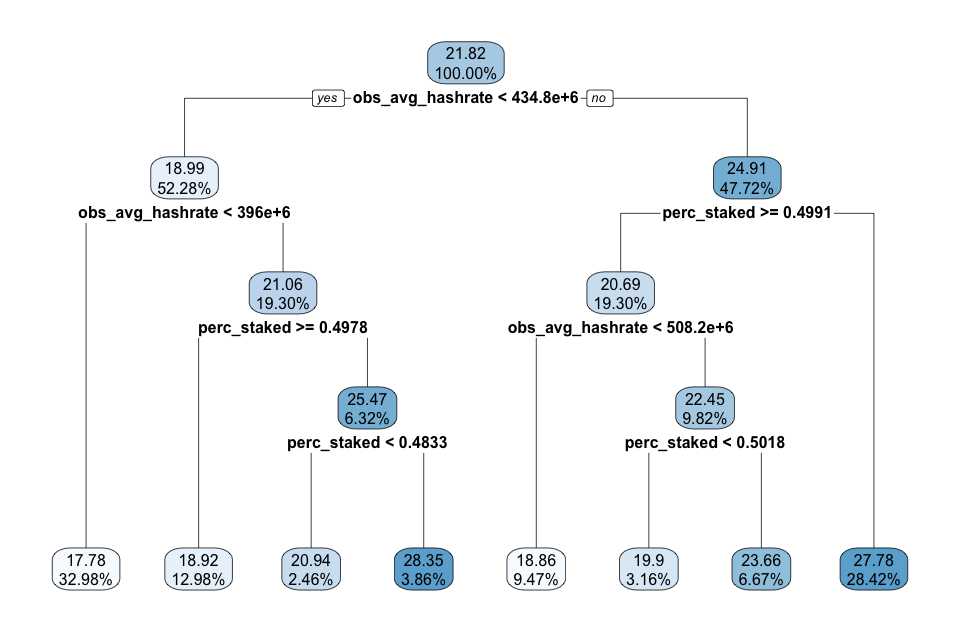
Figure 16 – Regression Tree with Hashrate and Staked Percentage
Source: own elaboration
| AVGPRICE | HASHRATE | STAKED PERCENTAGE | COVER |
|---|---|---|---|
| 17.78 | < 395.9e+06 | . | 32.08% |
| 18.86 | 434.7e+06 to 508.2e+06 | >= 0.4991 | 9.47% |
| 18.92 | 395.9e+06 to 434.7e+06 | >= 0.4978 | 12.98% |
| 19.90 | >= 508.2e+06 | 0.4991 to 0.5018 | 3.16% |
| 20.94 | 395.9e+06 to 434.7e+06 | < 0.4833 | 2.46% |
| 23.66 | >= 508.2e+06 | >= 0.5018 | 6.67% |
| 27.78 | >= 434.7e+06 | < 0.4991 | 28.42% |
| 28.35 | 395.9e+06 to 434.7e+06 | 0.4833 to 0.4978 | 3.86% |
Table 30 – Regression Tree Rule Coverage
Source: own elaboration
| VARIABLE | IMPORTANCE |
|---|---|
| obs_avg_hashrate | 3675.12 |
| perc_staked | 3372.37 |
| obs_coin_issuance | 1137.87 |
| tx_sum | 1010.45 |
| tx_count | 642.22 |
Table 31 – Regression Tree, Variable Importance Score
Source: own elaboration
Figures 17 and 18 show two linear models: one with price and staked percentage and the other with price and hashpower. As shown in these figures, price tends to increase as hashpower increases but tends to a slight decrease when staked percentages go up. Both figures display data from 01 Jan 2019 until 10 Feb 2020.
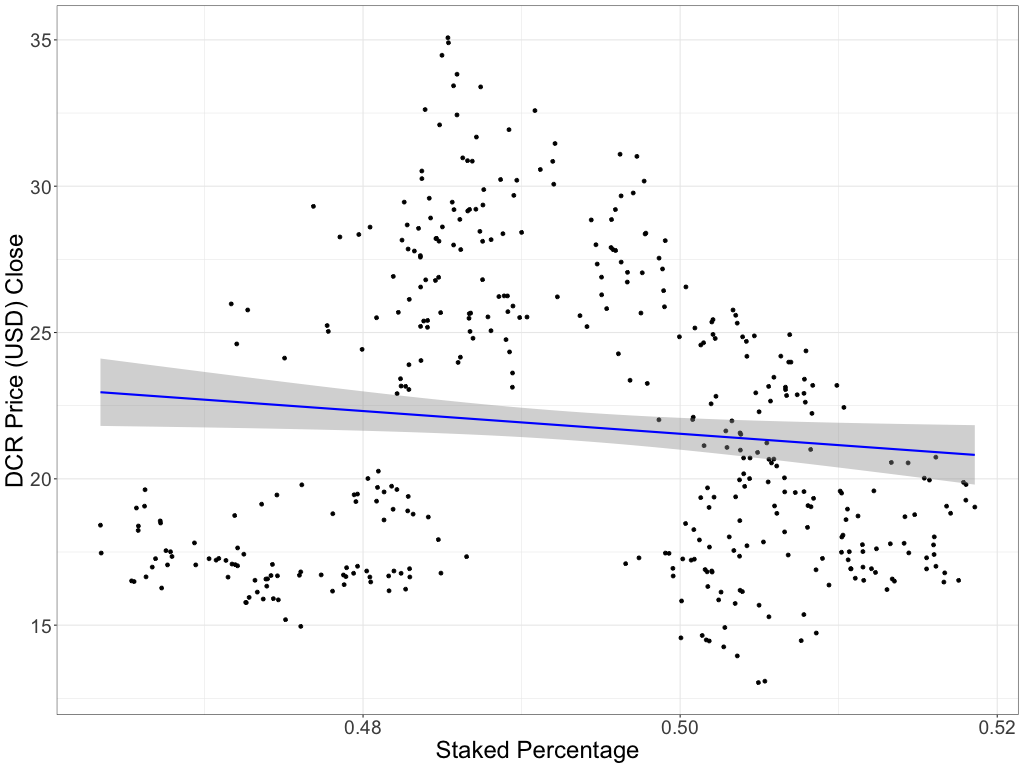
Figure 17 – Linear Model with Price and Staked Percentage
Source: own elaboration
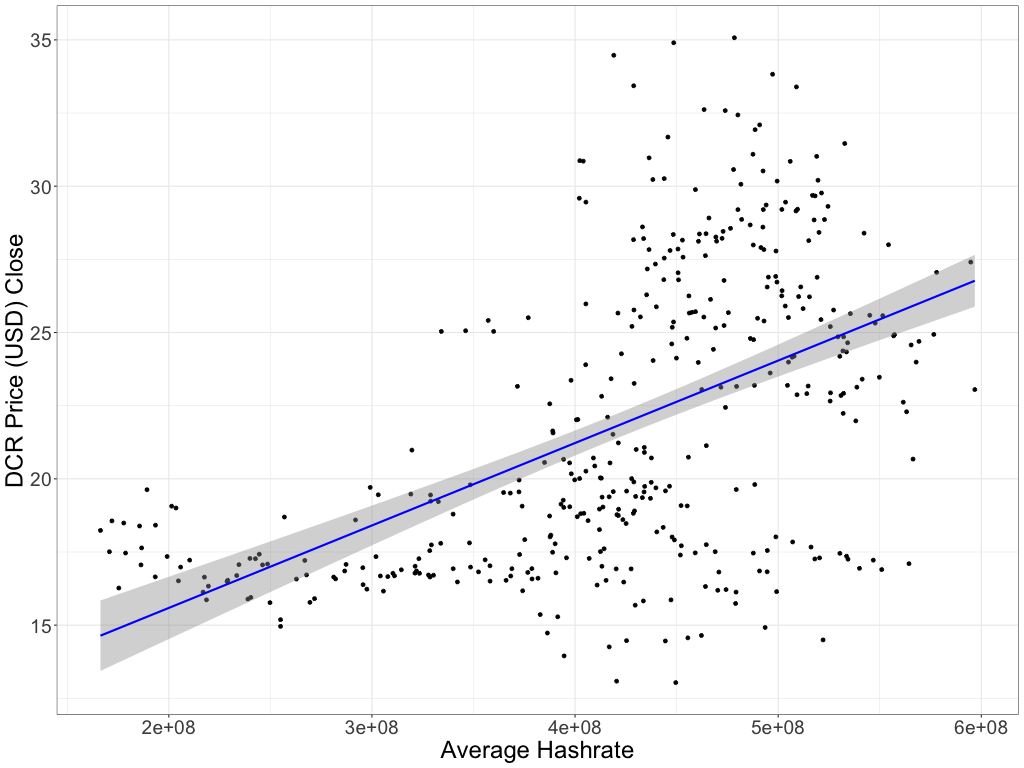
Figure 18 – Linear Model with Price and Hashpower
Source: own elaboration
Footnotes Permalink
1 DCRUSD exchange rates, available at https://finance.yahoo.com/quote/DCR-USD/history?period1=1454716800&period2=1586131200&interval=1d&filter=history&frequency=1d
2 “Bitcoin Jumps to Highest Level Since March’s Coronavirus Crash”, available at https://www.bloomberg.com/news/articles/2020-04-23/bitcoin-jumps-to-highest-level-since-march-s-coronavirus-crash
3 Decred Governance Data Analysis, available at https://github.com/mmartins000/decred-gov-data-analysis
4 Available at https://docs.decred.org/proof-of-stake/overview/
5 “Crypto Faithful Flip Out on Speculation Satoshi Sold Bitcoin”, available at https://www.bloomberg.com/news/articles/2020-05-20/crypto-faithful-freak-out-amid-speculation-satoshi-sold-bitcoin
6 NIST Hash Functions, available at https://csrc.nist.gov/projects/hash-functions
7 BLAKE-256 hash function, available at https://docs.decred.org/research/blake-256-hash-function/


Comments ()