

Bears showing signs of exhaustion
Macro mean reversion on EMA and Ichimoku cloud. Weekly range holding.
Welcome to my first analysis on Decred Society. We’ll be reviewing macro charts for Decred on it’s EMA, Ichimoku, and trading range performance.
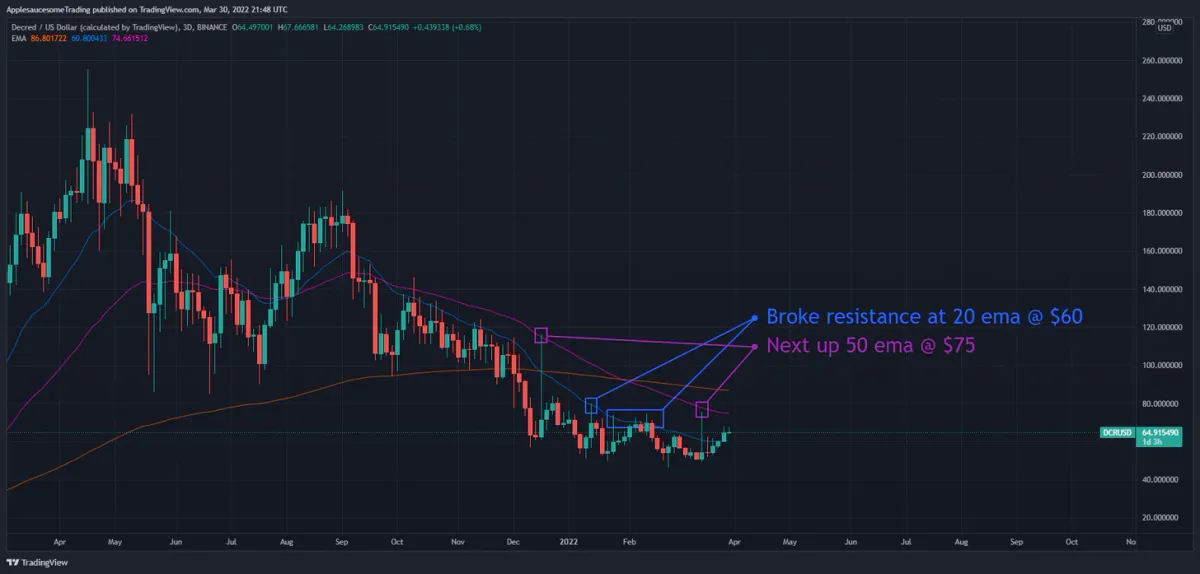
EMA
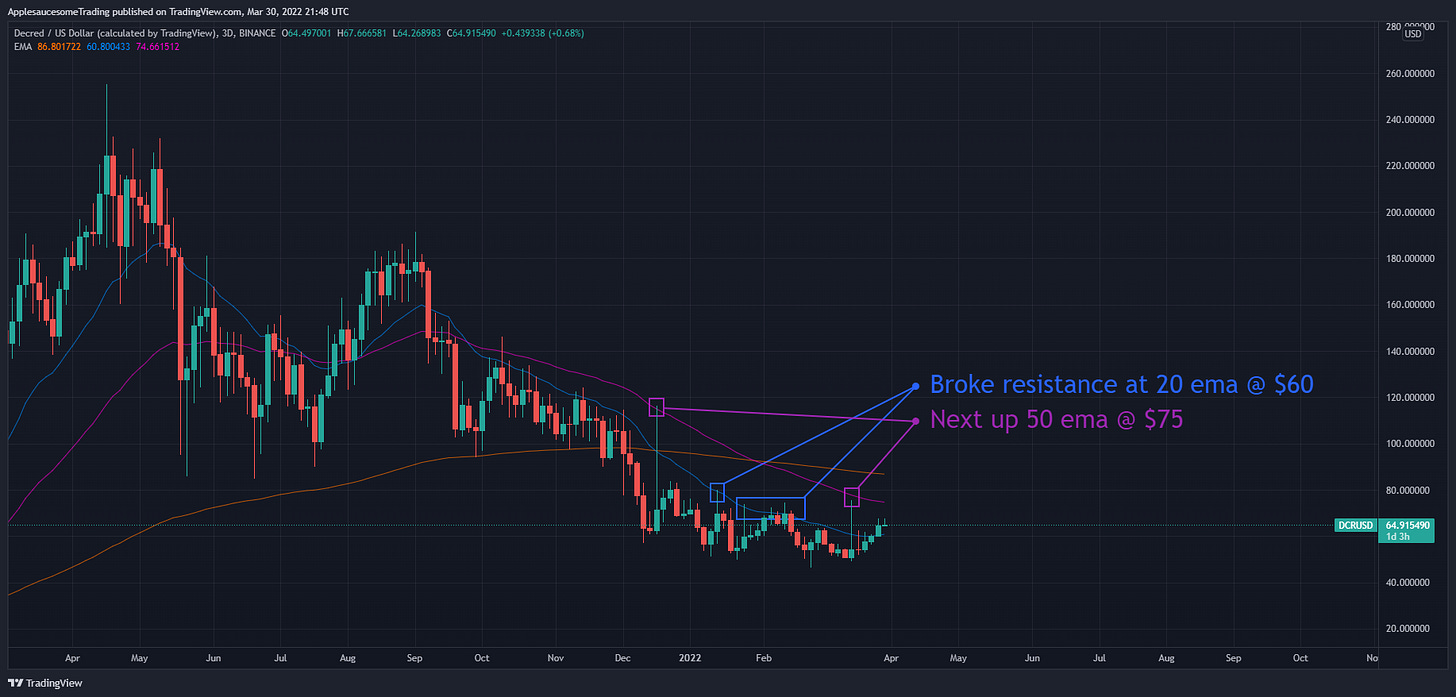
Decred broke through and closed a 3 day candle above the 20 ema. The next target would be $75 if it manages to continue the uptrend. Above that would target $86 at the 200 ema.
Ichimoku
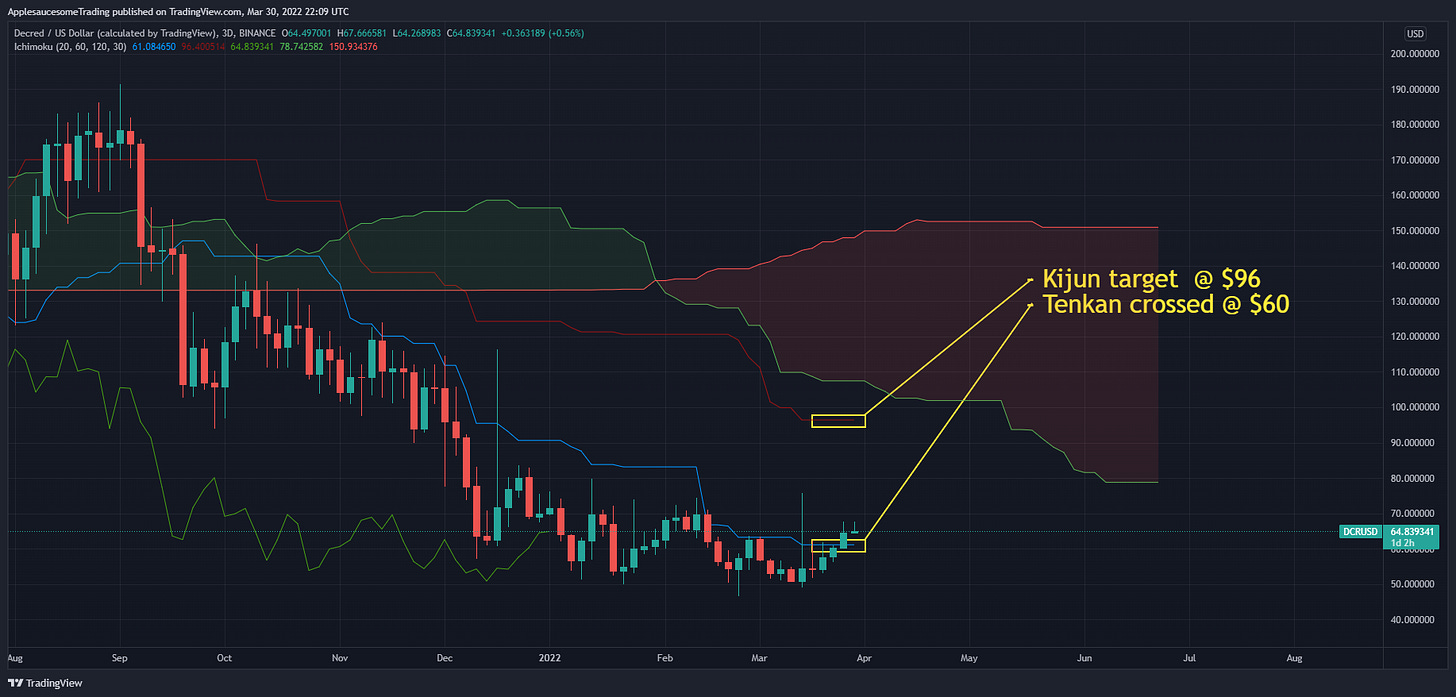
Decred also broke through and close a candle above the tenkan on the Ichimoku Cloud. The next potential target on 3 day candles would be around $96. There’s also potential for an end-to-end but that’s still a long ways off. The point though is that the cloud shows a very tasty risk/reward ratio currently if you have the patience and conviction for it.
Weekly trading range
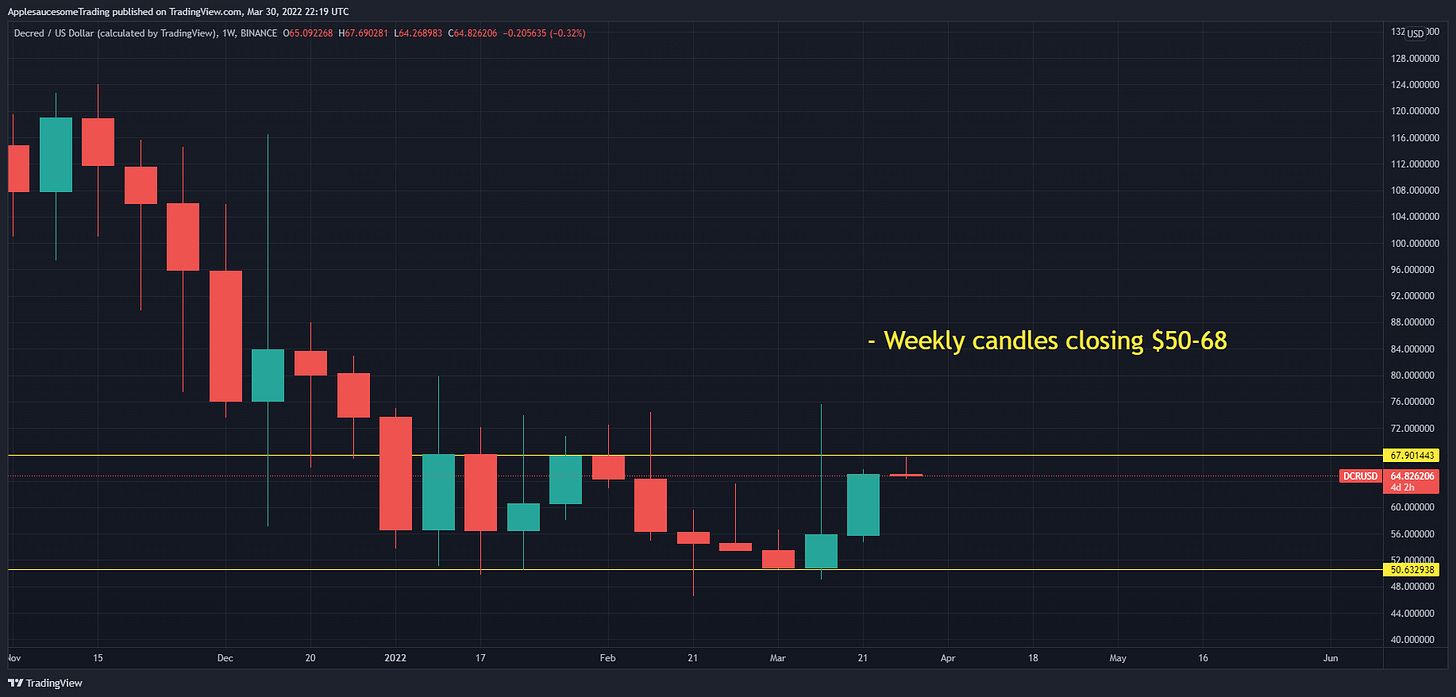
The weekly candles are closing solidly within a trading range. We wicked briefly to $47 but closed back into the range. I’d be extremely interested in any sub $50 DCR.
Future outlook
There is still a lot of indecision in the wider market at the moment. Leveraged traders are still in disbelief that this is the bottom and they’re the ones that spot traders squeeze for those nice green candles. I wouldn’t be surprised if we came back to test $50-60 but that doesn’t mean I’m bearish. The point is that we are showing solid signs of strength which is paramount in an accumulation range. You also can’t ignore the gigantic green candles that have been appearing as of late. Someone out there with deep pockets is buying and 10/80 is just around the corner.


Comments ()